RICE Scoring Model
RICE scoring prioritizes product ideas based on reach, impact, confidence, and effort to guide decision-making with structured reasoning.

What is the RICE Scoring Model?
The RICE scoring model is a prioritization framework that calculates priority scores for features or initiatives by multiplying Reach (how many people affected) times Impact (how much it helps those people) times Confidence (how sure you are about estimates) divided by Effort (work required to build). Think of it like a return-on-investment calculator specifically designed for product decisions, helping you compare apples to oranges by converting everything into a single numerical score. Developed by Intercom, this framework has become the gold standard for product teams who need to defend their roadmap decisions with data rather than opinions.
RICE transforms subjective debates about what to build next into objective discussions grounded in estimates and evidence. Instead of the loudest voice in the room winning, or building features just because the CEO asked, teams can point to clear scoring that shows why certain initiatives deserve resources while others should wait.
RICE Scoring in Product Development
RICE scoring brings clarity to the chaos of competing priorities. It works across B2B and B2C products, from early-stage startups to enterprise platforms managing thousands of feature requests.
Startup Product Decisions
Early-stage companies use RICE to avoid building features just because one customer asked. Notion used RICE scoring in their early days to prioritize database functionality over formatting features, a decision that defined their market position. The framework helped them say no to 80% of requests while building the 20% that mattered.
Enterprise Roadmap Planning
Large organizations apply RICE across portfolios of products. Salesforce uses modified RICE scoring to allocate resources across clouds, considering reach at the account level rather than individual users. This helped them identify that CPQ improvements would impact their largest accounts despite affecting fewer total users.
Platform Feature Prioritization
Marketplace platforms face unique challenges balancing buyer and seller features. Etsy's RICE analysis revealed that seller tools had 3x higher impact on gross merchandise value than buyer features, reshaping their roadmap. They measure reach differently for two-sided impact.
Technical Debt Decisions
Engineering teams adapt RICE for infrastructure projects. Stripe includes "risk mitigation" in their impact score for security and reliability features. This helped them justify investing in a new payment processing engine that touched every transaction despite no visible user features.
RICE Components Deep Dive
Reach Estimation
• Users impacted per time period (typically per quarter)
• Percentage of user base affected
• Transaction or revenue volume touched
• Frequency of use multiplied by user count
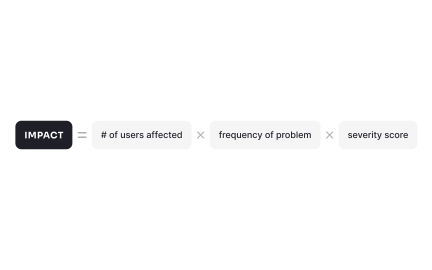
Impact Scoring Scale
• 3 = Massive impact (game-changing for users)
• 2 = High impact (significant improvement)
• 1 = Medium impact (noticeable enhancement)
• 0.5 = Low impact (minor improvement)
• 0.25 = Minimal impact (barely noticeable)
Confidence Levels
• 100% = High confidence (data-driven, tested)
• 80% = Medium-high (strong indicators)
• 50% = Medium (educated guess)
• 20% = Low (mostly assumptions)
Effort Estimation
• Person-weeks or person-months
• Story points converted to time
• Include all disciplines (design, engineering, QA)
• Consider maintenance and support costs
Week 1: Define your scoring scales and gather baseline data. Decide what "reach" means for your product (users, accounts, transactions?). Create impact definitions from "minimal" (0.25) to "massive" (3). Set confidence levels based on evidence types. Estimate effort in person-weeks or story points.
Week 2: Score your current backlog using the framework. Start with 10-20 items to calibrate scores across the team. Document assumptions behind each score. Calculate RICE scores: (Reach × Impact × Confidence) ÷ Effort. Rank items and identify surprises.
Month 1: Integrate RICE into planning cycles. Require RICE scores for new feature requests. Build dashboards showing score distributions. Review actual impact versus predictions for completed features. Adjust scoring scales based on learnings.
Month 2: Expand beyond features to bugs, technical debt, and experiments. Create templates for common request types. Automate reach calculations from analytics. Establish RICE review meetings. Share framework with stakeholders for transparency.
Recommended resources
Courses

Product Discovery


Product Analytics

Introduction to Product Management

Lessons

Finding AI Opportunities

The Frameworks that Guide You