Navigating Trade-offs and Priorities
Master strategic decision-making to balance competing needs and constraints in product development
Product development is a complex dance of competing interests, limited resources, and high expectations. Every design decision carries implications across user experience, technical feasibility, business goals, and team capacity. Successful navigation of these trade-offs requires strategic thinking, clear communication, and a deep understanding of project priorities. Through effective prioritization frameworks, teams can transform overwhelming feature lists into actionable roadmaps, balancing user needs with business objectives.
Cross-functional collaboration becomes the cornerstone of informed decision-making, where designers, developers, and product managers align their perspectives to find optimal solutions. Rather than viewing constraints as limitations, teams must learn to leverage them as creative catalysts, leading to innovative solutions that respect both user needs and organizational realities. This dynamic process of evaluating options, weighing consequences, and making confident choices ultimately determines a product's success in the market.
The MoSCoW method provides a clear framework for prioritizing features and requirements based on their importance to project success. The acronym stands for must-have, should-have, could-have, and won't-have, creating distinct categories that help teams make informed decisions about resource allocation.
Here’s what they each mean:
- Must-have items represent core functionalities without which the product would fail.
- Should-have items are important but not critical for launch, offering significant value that can be temporarily delayed if necessary.
- Could-have features are desirable but have minimal impact on project outcomes, making them ideal candidates for future iterations.
- Won't-have items are explicitly excluded from current development plans, helping teams maintain focus and manage stakeholder expectations.[1]
Apply specific pre-determined criteria when categorizing. For an e-commerce app, secure payment (must-have) enables core business function, while social sharing (could-have) adds optional value but isn't essential for success.
Pro Tip: Start MoSCoW prioritization by limiting must-haves to no more than 60% of total requirements to maintain flexibility and prevent scope creep.
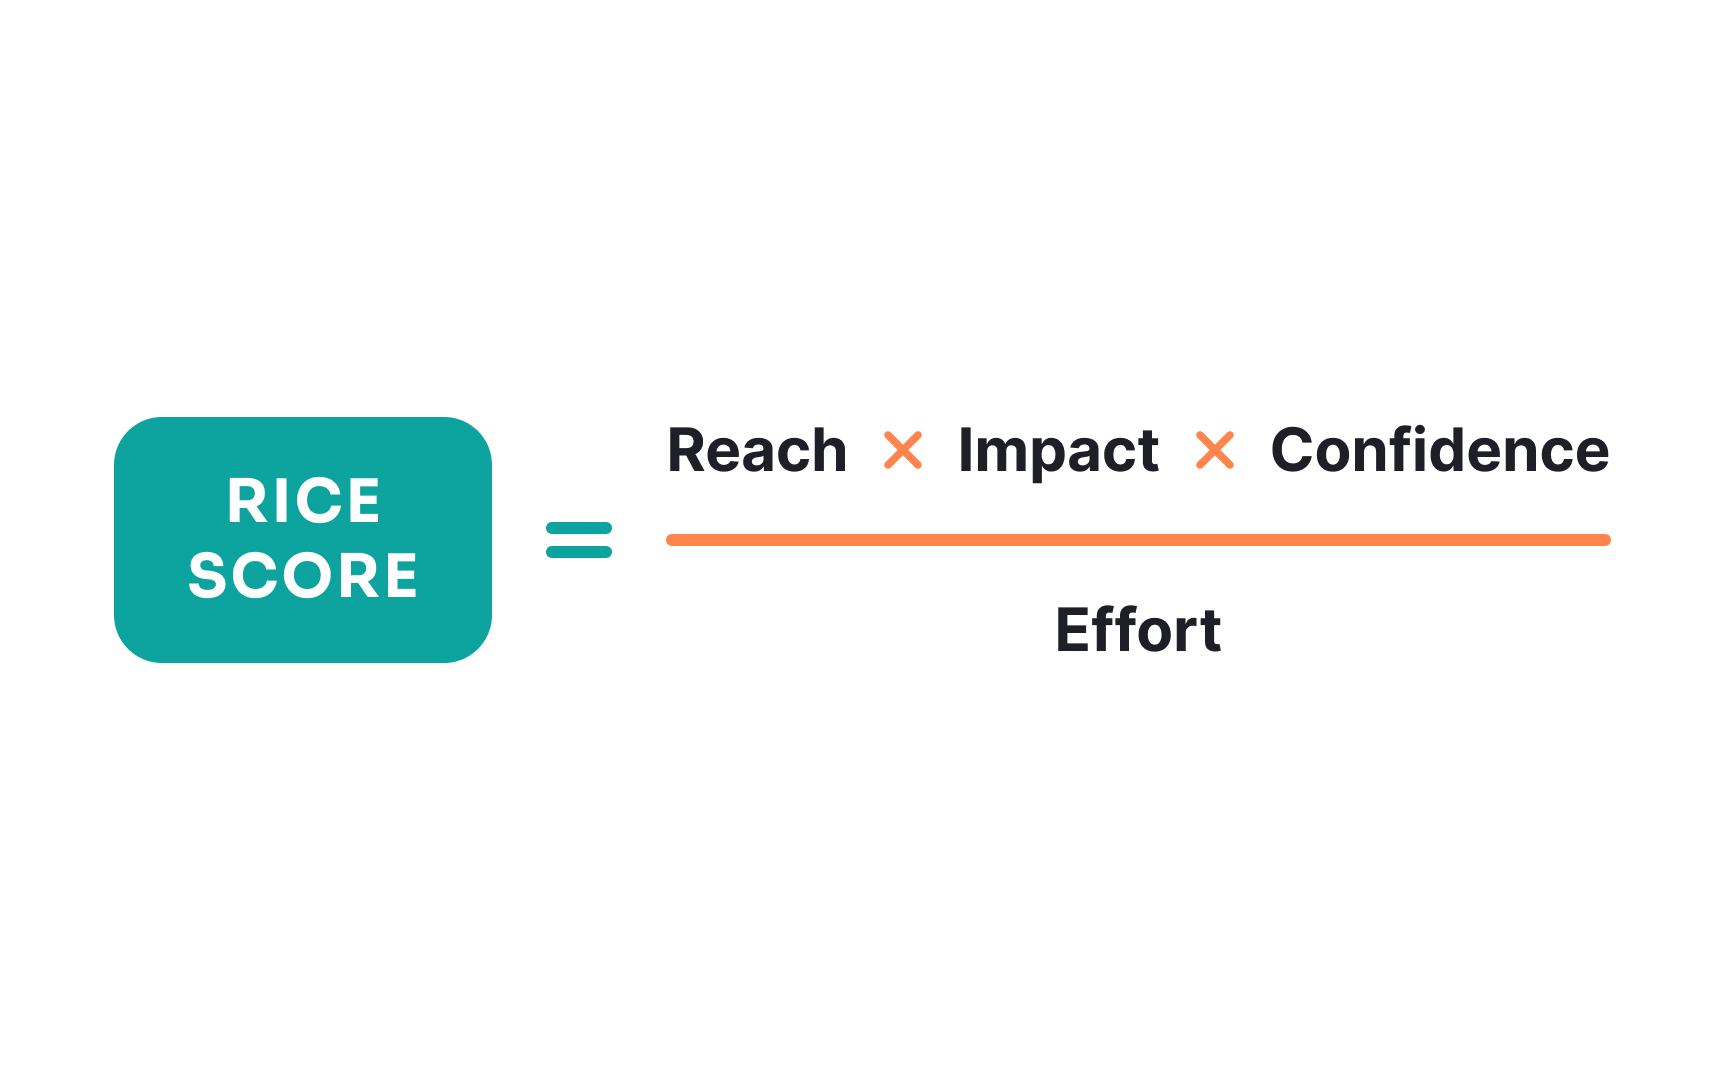
The RICE framework transforms subjective prioritization into a data-driven process using 4 key factors:
- Reach measures the number of users affected by a feature within a specific time period, such as quarterly active users.
- Impact evaluates how effectively the feature contributes to desired outcomes on a scale from minimal (0.25) to massive (3.0).
- Confidence reflects the reliability of estimates, expressed as a percentage based on available data and research quality.
- A high-confidence idea backed by solid user research might score 100%, while assumptions with minimal validation might receive 50%.
- Effort represents the total work required, typically measured in team weeks (e.g., one team member working for 4 weeks = 4 weeks of effort) or standard development story points.[2]
Calculate the RICE score by multiplying reach, impact, and confidence, then dividing by effort: (R × I × C) ÷ E. For example, a feature reaching 5000 users (R), with moderate impact (I=1), 80% confidence (C=0.8), requiring 4 weeks of effort (E) scores: (5000 × 1 × 0.8) ÷ 4 = 1000. Higher scores indicate better investment opportunities, enabling objective comparison between competing ideas.
Pro Tip: When uncertain about reach, use conservative estimates and adjust the confidence score accordingly to reflect this uncertainty in your calculations.
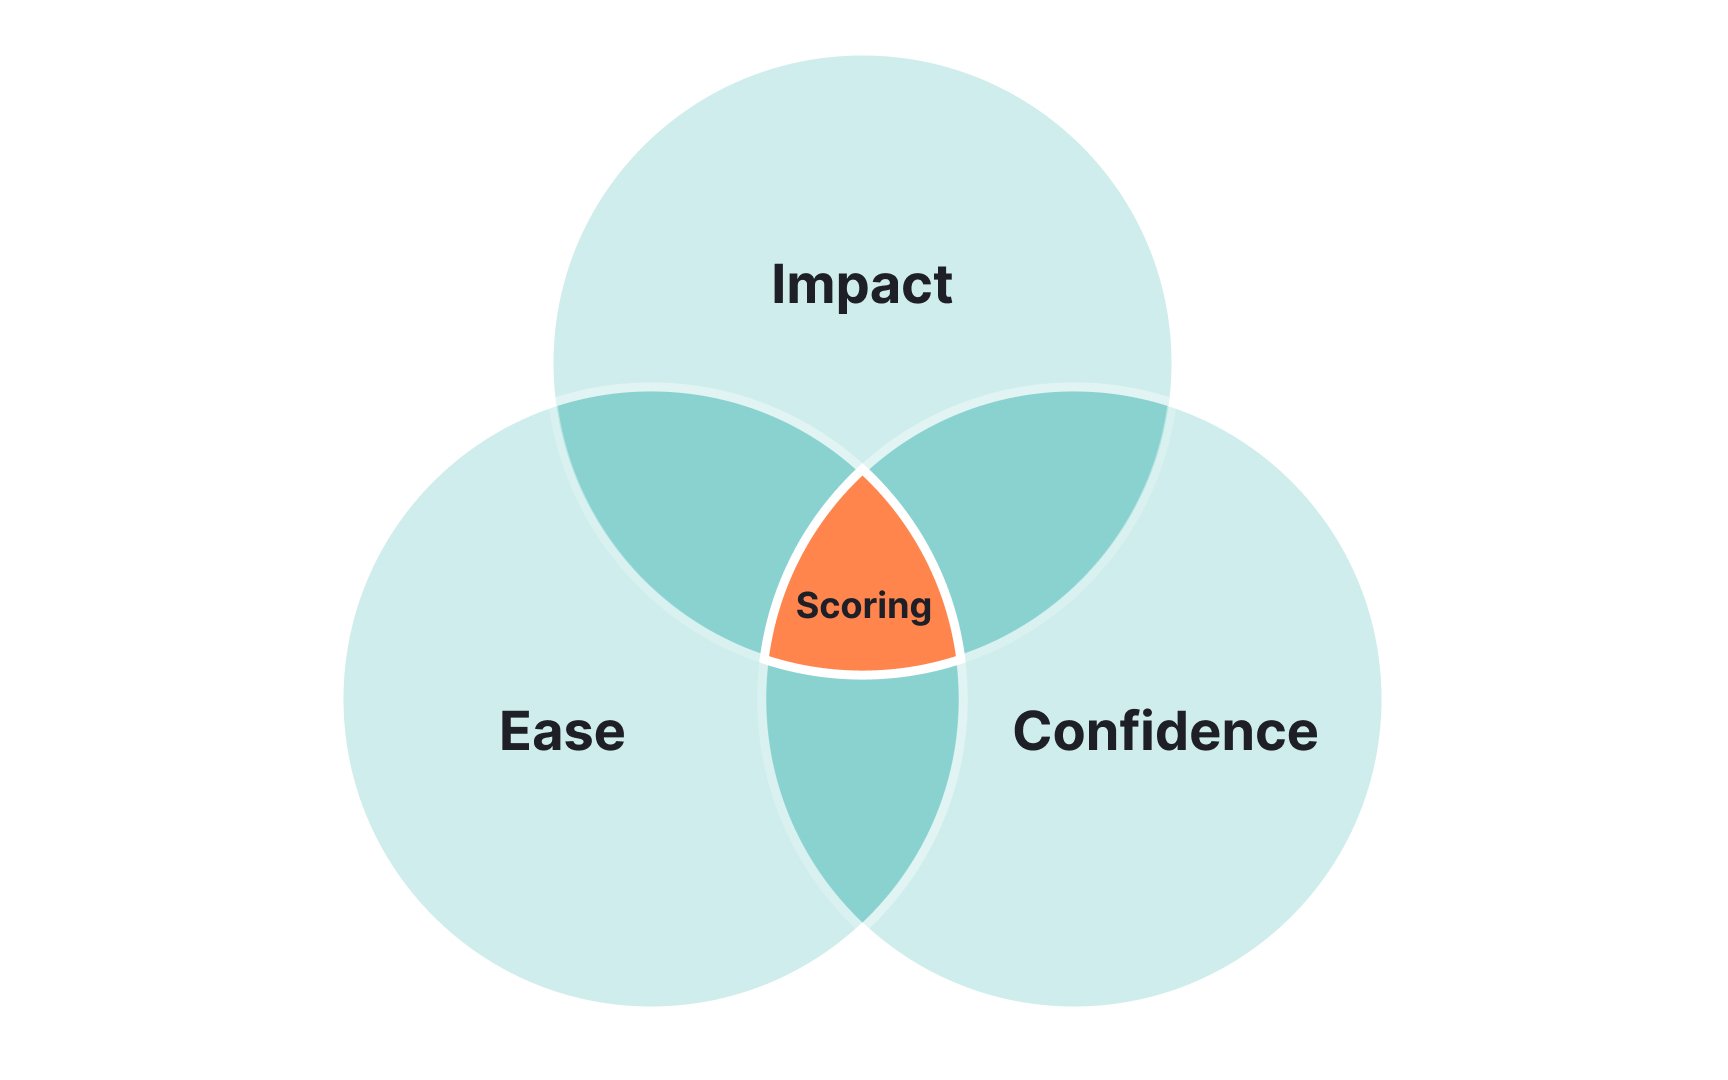
The ICE framework offers a streamlined approach to prioritization using 3 key factors:
- Impact measures the potential positive effect on key business or user metrics on a scale of 1-10, where 1 represents minimal change and 10 indicates a transformative improvement. This assessment focuses on direct contributions to strategic goals.
- Confidence rates the reliability of your impact and ease estimates on a scale of 1-10, based on available data and past experiences. A score of 10 indicates solid evidence from comparable projects or
user research , while lower scores reflect assumptions with limited validation. - Ease evaluates implementation simplicity, where 10 means quick implementation with existing resources, and 1 indicates significant complexity or resource requirements.[3]
Calculate the ICE score by multiplying these 3 factors together and dividing by 10: (I × C × E) ÷ 10. For example, a feature with high impact (8), moderate confidence (6), and high ease (9) scores: (8 × 6 × 9) ÷ 10 = 43.2.
Higher scores suggest more favorable ideas, making it simple to compare and rank different options while accounting for both potential value and implementation practicality.
Pro Tip: Keep scoring consistent by creating a reference sheet of past features and their scores — use these as benchmarks when evaluating new initiatives.
Priority poker transforms feature
Here’s how it works:
- The process starts with feature cards containing clear descriptions, user value, and implementation context.
- Each participant receives a set of priority cards with values following a modified Fibonacci sequence (1, 2, 3, 5, 8, 13, 21) representing relative priority levels.
- After reviewing the feature card, participants privately select a priority card based on predefined criteria such as business value, user impact, and technical feasibility.
- After simultaneous card reveals, participants with significantly different scores share their reasoning, leading to valuable discussions and uncovering hidden concerns or opportunities. For instance, a high score from a
UX designer might reveal critical user needs, while a low score from an engineer could uncover technical constraints. - Teams continue discussing and re-voting until reaching consensus, documenting key insights that influence the final priority score.
Create a quick reference guide for scoring criteria and keep it visible during sessions to ensure consistent evaluation across team members and features.
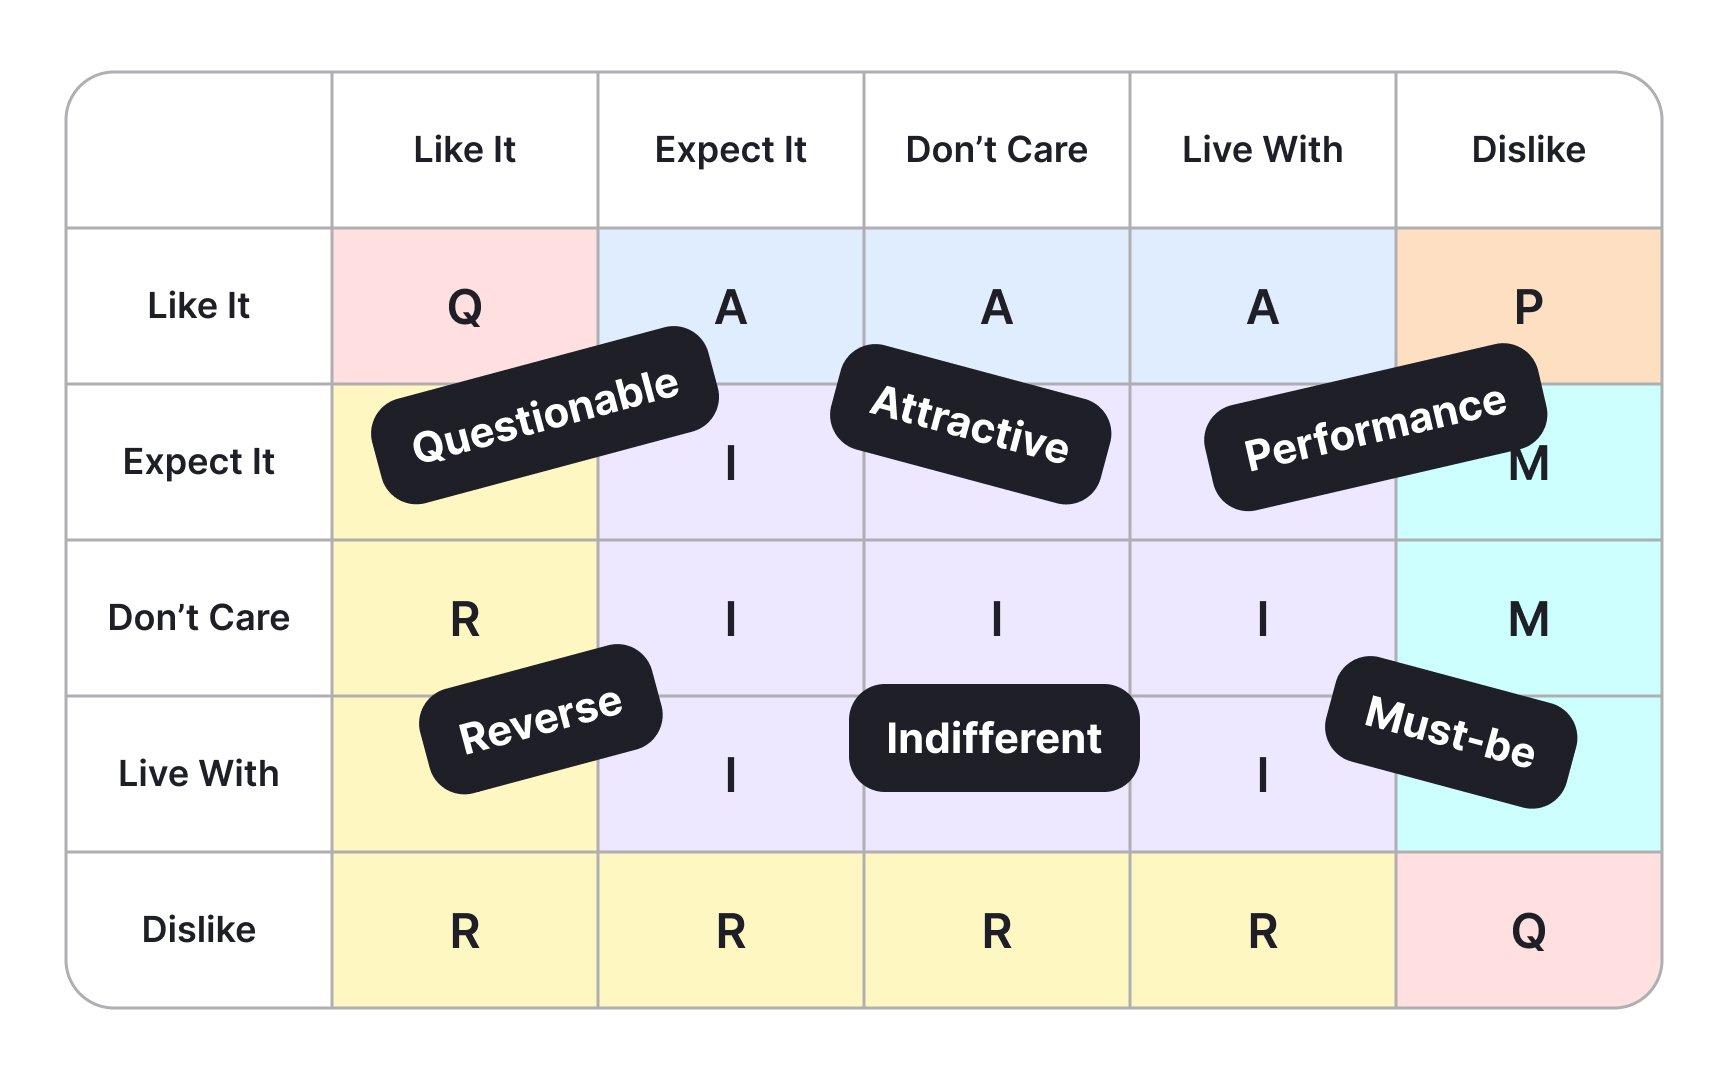
The Kano Model classifies product features based on their potential to satisfy or dissatisfy users, identifying 5 distinct categories:
- Must-be features represent basic expectations that cause significant dissatisfaction when absent but don't increase satisfaction when present — like a smartphone's ability to make calls.
- Performance features demonstrate linear satisfaction — better implementation leads to higher satisfaction. For example, faster page load times.
- Attractive features delight users when present but cause no dissatisfaction when absent, making them powerful differentiators. Consider one-click ordering in e-commerce — unexpected but highly appreciated.
- Indifferent features neither satisfy nor dissatisfy users.
- Reverse features actually decrease satisfaction despite being intended as improvements, often due to poor implementation or misaligned user needs.
The classification process involves surveying users with functional ("How do you feel if this feature is present?") and dysfunctional ("How do you feel if this feature is absent?") questions. Responses are mapped on the Kano evaluation table, providing clear categorization. This can help prioritize features that maximize user satisfaction while avoiding investment in unnecessary or potentially detrimental features.
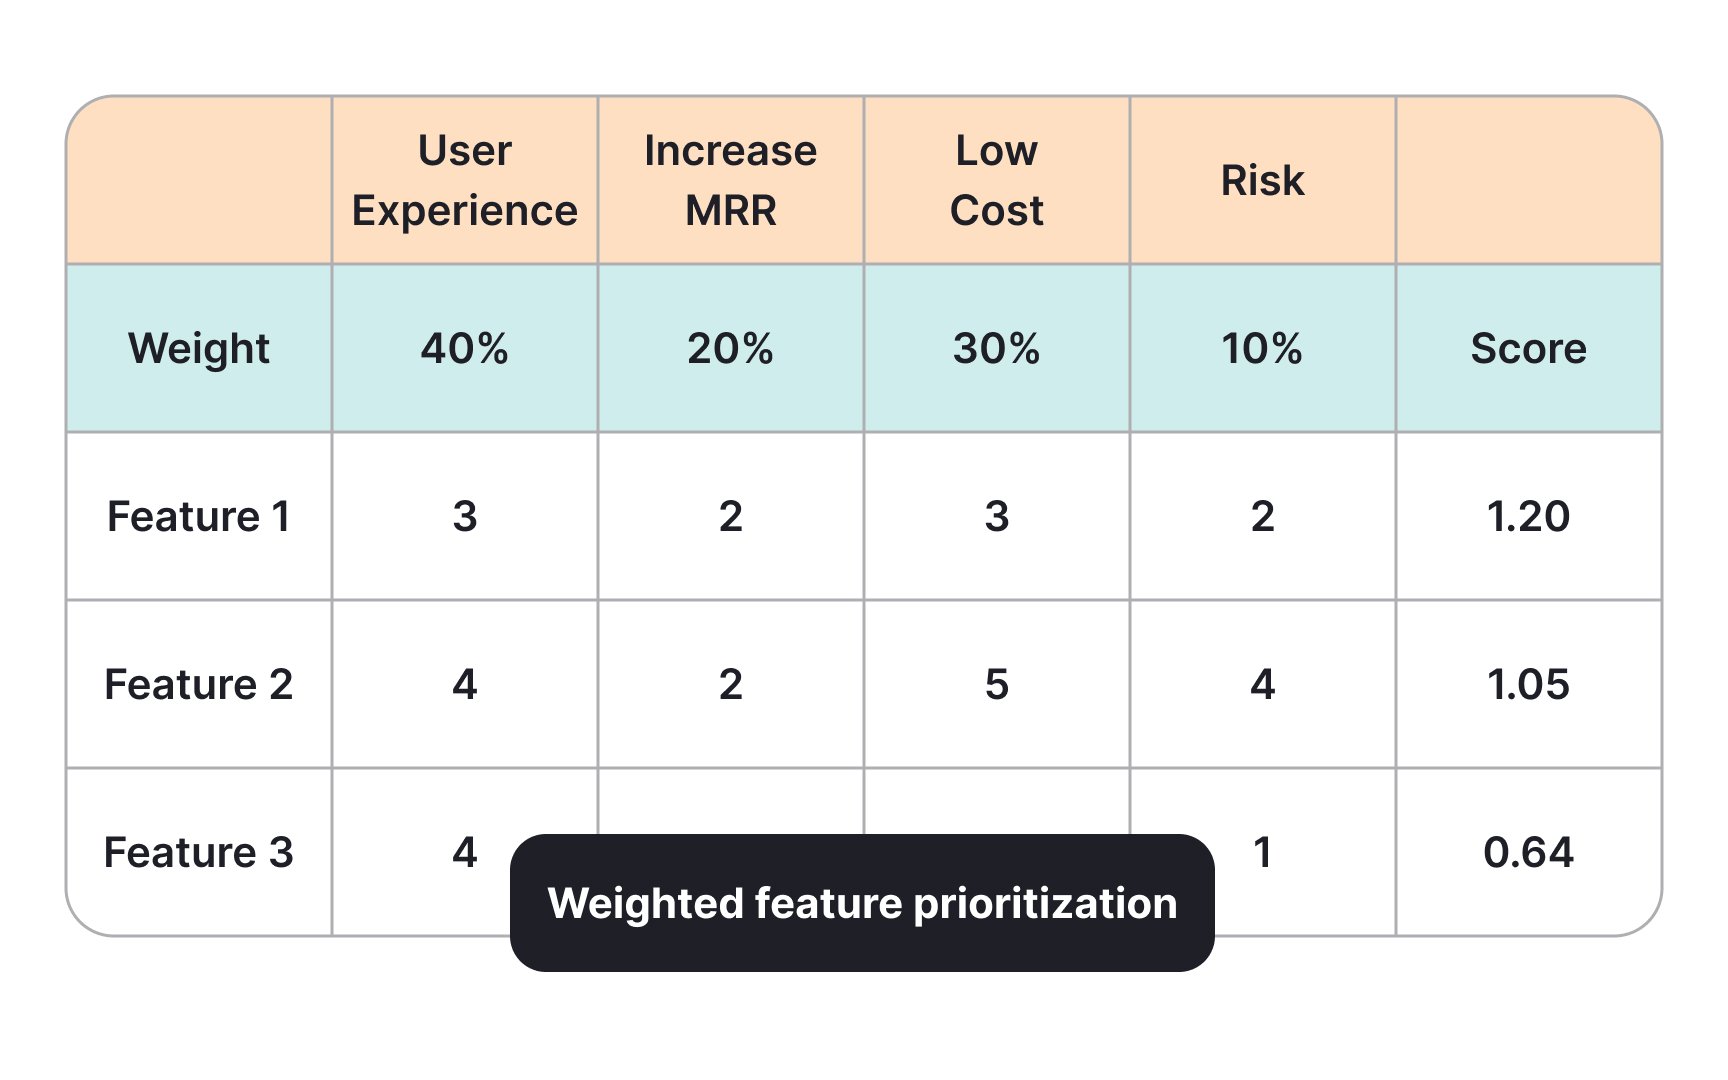
The weighted scoring model brings mathematical rigor to
Here’s how it works:
- Features receive scores from 1-5 for each criterion, where 1 represents minimal alignment and 5 indicates perfect alignment.
- Multiply each score by its corresponding criterion weight to calculate weighted scores. For example, if user impact has a 30% weight and a feature scores 4 in this category, its weighted score would be 1.2 (4 × 0.30). The sum of all weighted scores becomes the feature's final priority score.
- Common criteria include strategic alignment (25%), user value (30%), implementation effort (20%), technical risk (15%), and revenue impact (10%). So, a feature scoring 4, 3, 5, 2, and 4 respectively would calculate as: (4×0.25) + (3×0.30) + (5×0.20) + (2×0.15) + (4×0.10) = 3.65.
Review and adjust criteria weights quarterly to ensure they align with current business objectives and market conditions.
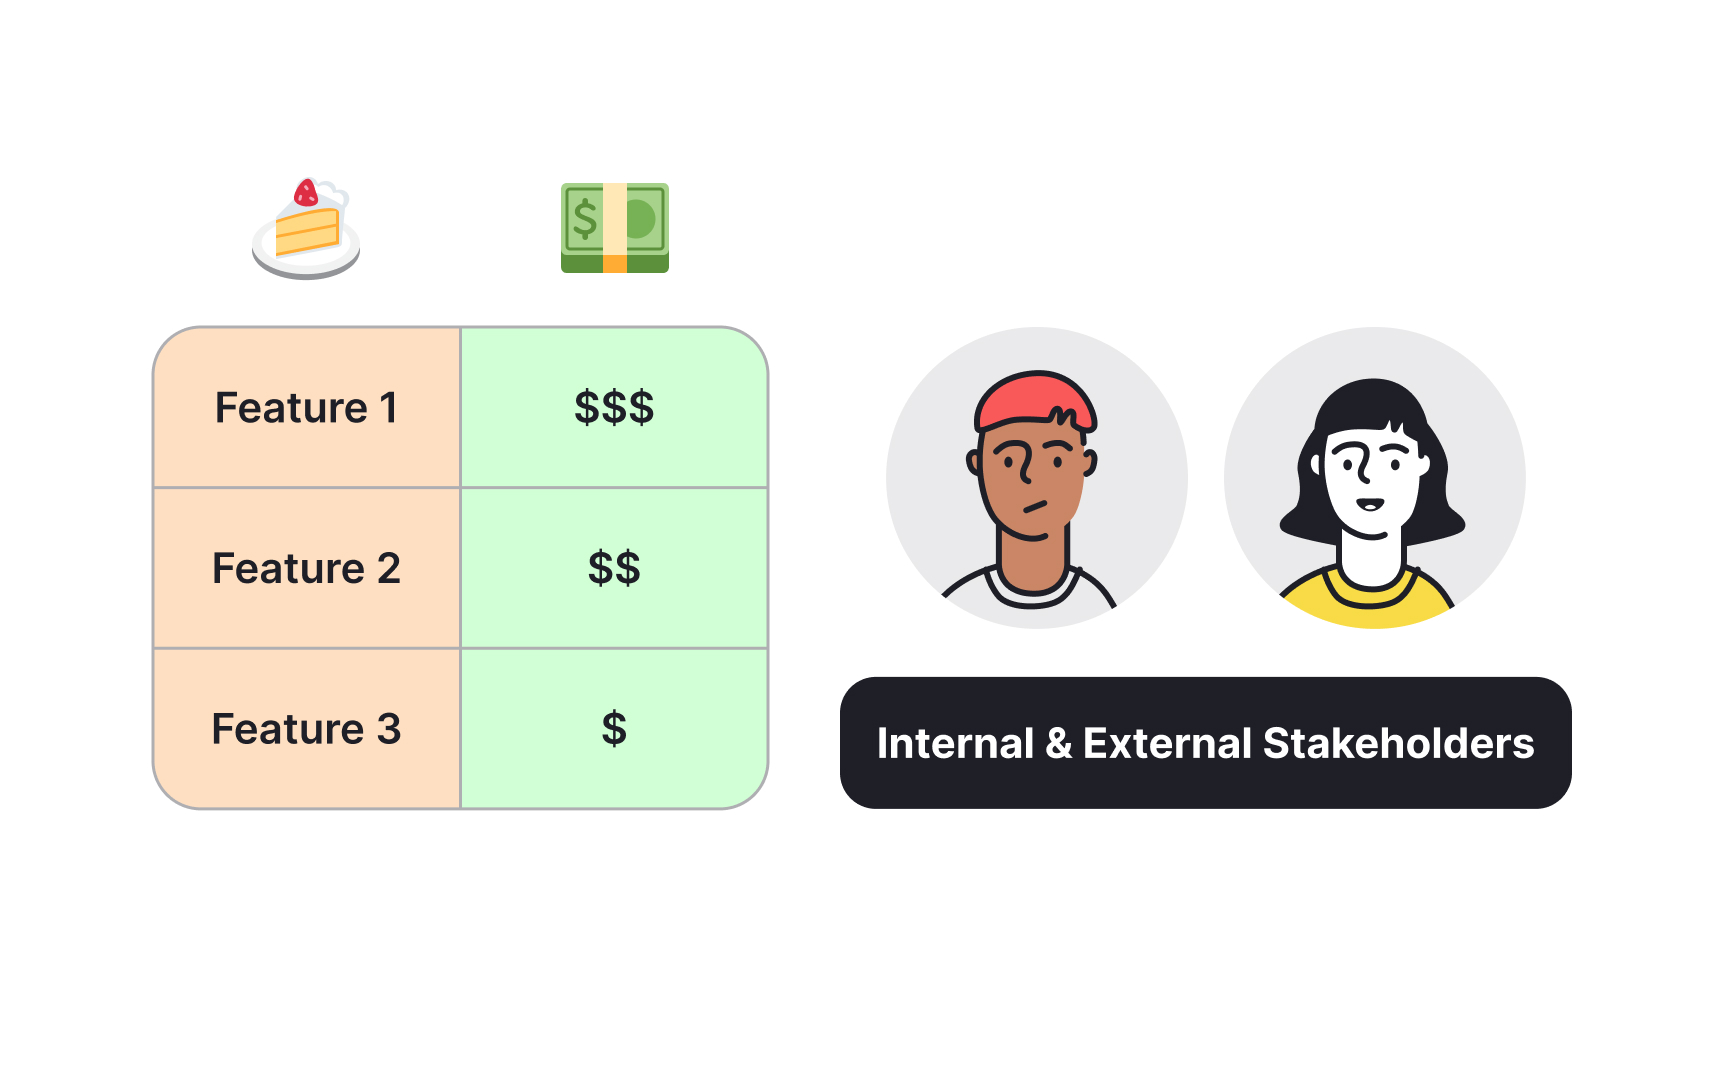
Buy-a-feature
Here’s how it works:
- Each participant receives a fixed budget (typically virtual currency or points) representing a portion of available resources.
- Features are assigned costs based on their implementation complexity, resource requirements, and relative size.
- Stakeholders participate in a structured purchasing session where they can spend their budget on desired features.
- They may collaborate, pooling resources to afford high-cost features they collectively value. For example, if a complex AI recommendation engine costs 100 points, multiple stakeholders might combine their budgets to secure this priority. This natural collaboration reveals genuine organizational priorities and encourages transparent discussion about trade-offs.
The exercise concludes with analysis of purchasing patterns and discussions about investment choices. For example, when the VP of Sales and Customer Success Manager pool resources for the same feature, it signals strong cross-functional alignment. The process also captures valuable insights through participant discussions — stakeholders must articulate why they're willing to spend on certain features, providing concrete justification for prioritization decisions.
References
- MoSCoW Prioritization | ProductPlan
- RICE Scoring Model | ProductPlan
- ICE Scoring Model | ProductPlan
Topics
From Course
Share


Similar lessons

Who is a Design Leader?

Leadership Styles
