Visualizing complex information
When technical, design, and business perspectives collide, visualization breaks through communication barriers in ways that words alone cannot. Effective visual facilitation techniques include:
- Low-fidelity sketching. Use simple shapes and arrows to map processes, user flows, or system architecture. The goal isn't artistic skill but clarity. Even basic diagrams help teams "see" the same problem differently.
- Physical or digital spatial arrangement. Position related concepts near each other and create visual hierarchies to show importance. When teams can physically move ideas around (using sticky notes or digital cards), new patterns and priorities emerge.
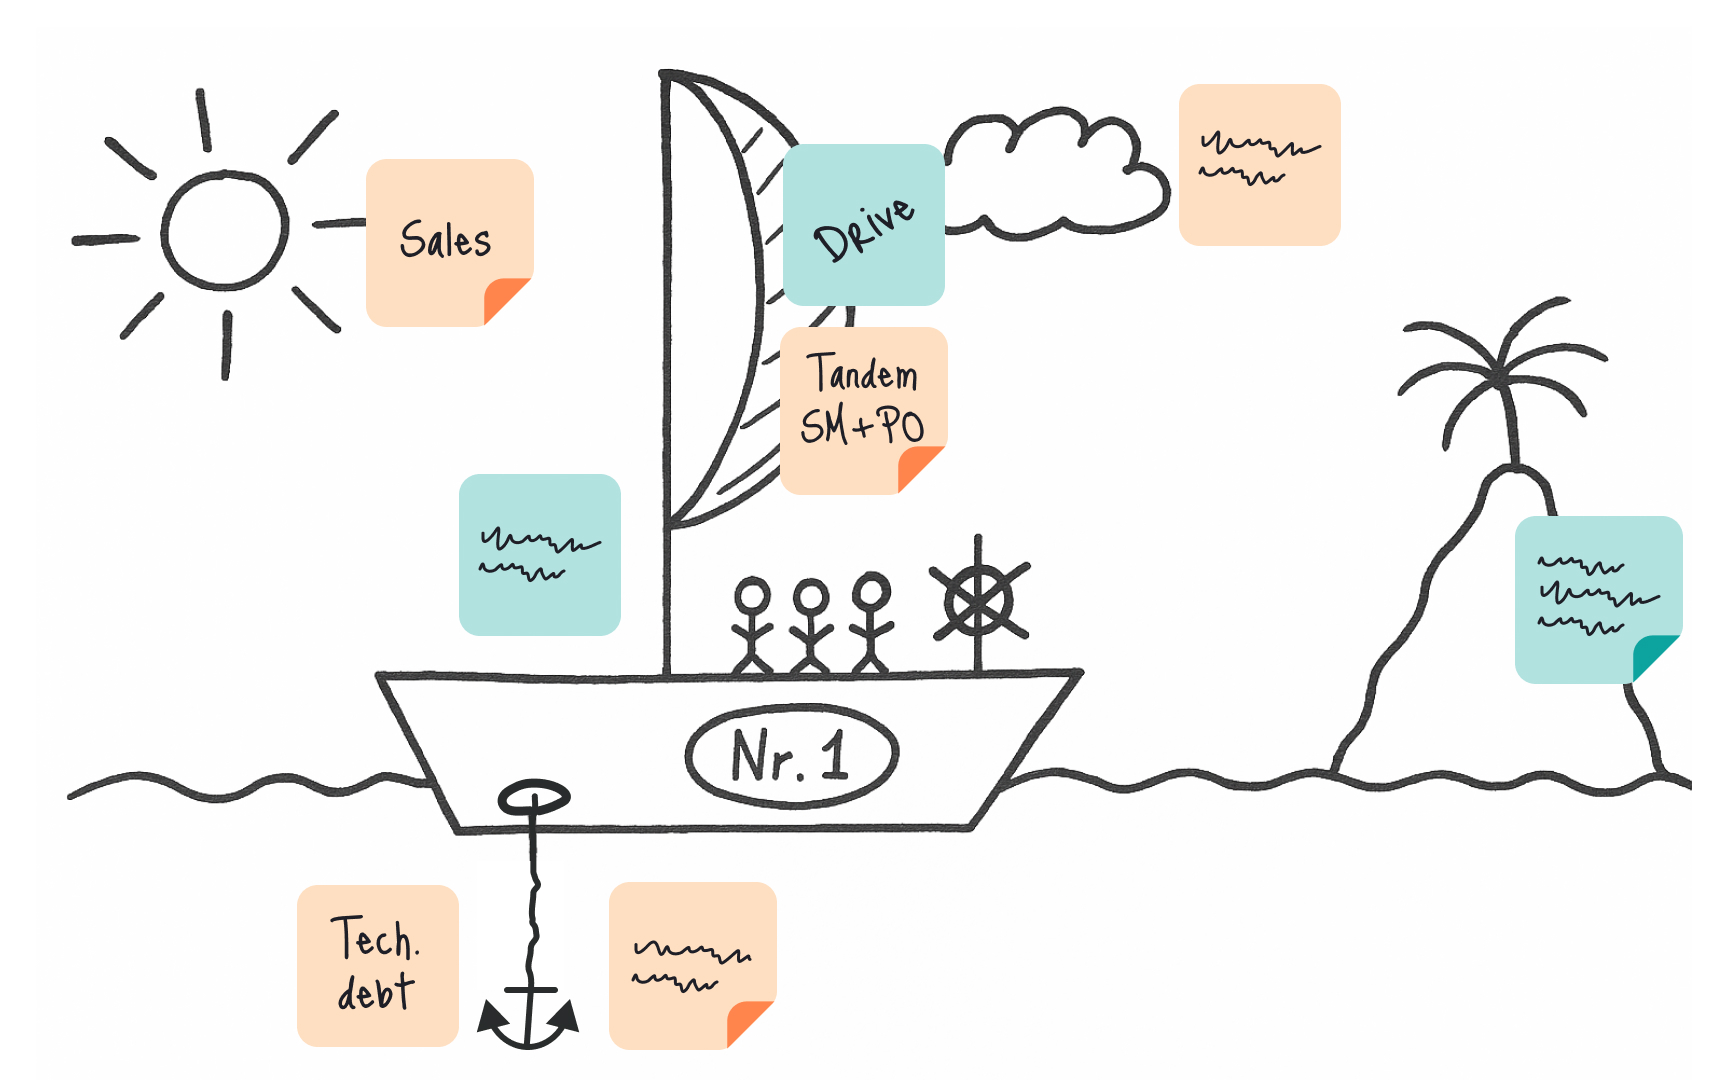
- Color coding and visual metaphors. Use consistent colors to distinguish themes, statuses, or ownership. Visual metaphors like mountains (challenges), bridges (connections), or rivers (workflows) help teams think about complex problems in new ways.
The most valuable visualizations happen in real-time, as the conversation unfolds.
Pro Tip: When someone says, "I'm not sure I understand," skilled facilitators respond with "Let me draw what I'm hearing" rather than repeating the same explanation verbally.
