HR Analytics - Case Study
Introduction:
HR Analytics specializes in delivering data-driven insights, technology-driven solutions, and strategic advisory services to optimize human resources and enhance organizational performance. Our primary goal was to design a user-friendly and intuitive platform that seamlessly offers services like advanced analytics, compensation and benefits strategies, HR technology integration, and employee engagement and retention tools. With a time-sensitive project, we executed various steps of the UX/UI design process, ensuring high-quality deliverables within a project timeline of 10 weeks.
1. User Research & Discovery
Objectives: Understand the needs and pain points of the HR industry, particularly in areas related to data-driven insights and employee engagement.
Methods: Conducted surveys and interviews with HR managers, reviewed competitive platforms and analyzed the existing challenges in HR management.
Findings:
- Many HR professionals struggle with data interpretation.
- Need for clear benchmarking solutions.
- Frustrations with existing HR tools that lack customization.
2. User Personas
3. Customer Journey Maps
4. Empathy Maps
Empathy maps help understand the thoughts, feelings, behaviors, and needs of users. Below are the detailed empathy maps for Sarah (HR Manager) and Jan (Business Owner).
5. Wireframing & Prototyping
- Created low-fidelity wireframes to outline the user flow.
- Iterated through several design rounds based on feedback.
- Built high-fidelity prototypes using Figma for detailed screens and interactions.
6. Visual Design
- Focused on a clean, professional design language to align with HR Analytics' branding.
- Used a color palette that conveys trust and professionalism (blues and greys).
- Ensured accessibility by following WCAG guidelines.
- Delivered responsive layouts for desktop, tablet, and mobile devices.
7. Development Collaboration & Handoff
- Provided detailed design specifications to developers.
- Collaborated closely with the development team to ensure design fidelity.
- Utilized Zeplin for a smooth handoff and ensured all assets were properly annotated.
8. User Testing & Feedback
- Conducted usability testing with a select group of HR professionals.
- Gathered feedback on ease of navigation, data visualization, and user satisfaction.
- Made adjustments based on the insights gained, including simplifying some interactions and refining the dashboard views.
9. Post-Launch Feedback & Iteration
- Continued gathering user feedback post-launch to identify areas for further improvement.
- Focused on improving the dashboard functionality and real-time data reporting features based on user suggestions.
- Iterations planned to enhance performance and add more customization options.
Conclusion:
The project’s UX process was tailored to the unique needs of HR professionals. By prioritizing user research, creating detailed personas, and continuously refining the design through testing and feedback, we ensured a solution that meets both user needs and business objectives. The final product, HR Analytics, not only addresses common pain points in HR management but also empowers users with advanced tools like ENGAGED and BOTTOMLINE, driving performance and employee satisfaction.
Timeframe: 10 Weeks.
Tools Used in the UX/UI Design Process for HR Analytics:
Research & Discovery:
- Google Forms/Typeform: For user surveys and gathering initial feedback.
- Teams: For conducting interviews with HR professionals.
- Trello: To manage and track research progress.
Personas, Empathy Maps, and Journey Maps:
- Miro: For creating detailed user personas, empathy maps, and customer journey maps collaboratively.
- Whimsical: Used for visualizing empathy maps and journey flows.
Wireframing & Prototyping:
- Figma: For designing wireframes, low-fidelity to high-fidelity prototypes.
Visual Design:
- Adobe Illustrator: For creating custom icons, illustrations, and visual elements.
- Photoshop: For image manipulation and visual assets.
- Figma: For design-to-development handoff and annotation of design specifications.
Development Collaboration:
- Teams: For real-time communication and feedback between design and development teams.
User Testing & Feedback:
- Maze: For conducting usability tests and collecting actionable insights from test participants.
- Google Analytics: To track user interactions post-launch and gather data for continuous improvement.
Post-Launch Feedback & Iteration:
- Hotjar: To monitor user behavior through heatmaps and session recordings for optimizing the design.
Tools used
Topics
Share
Reviews
0 reviews
You might also like
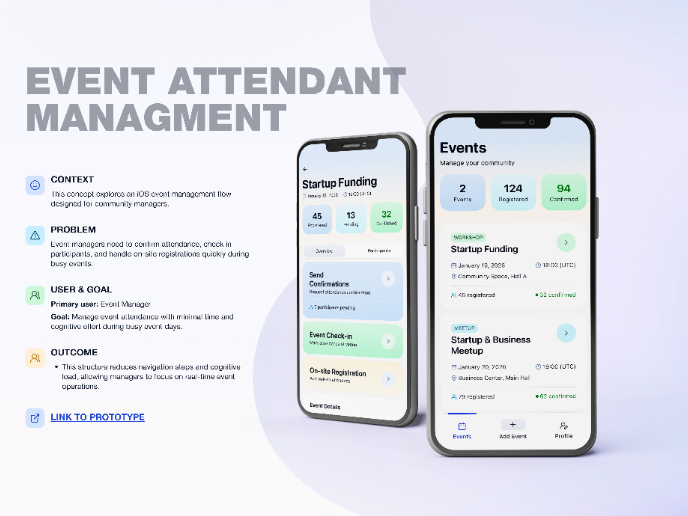
Events Managment App
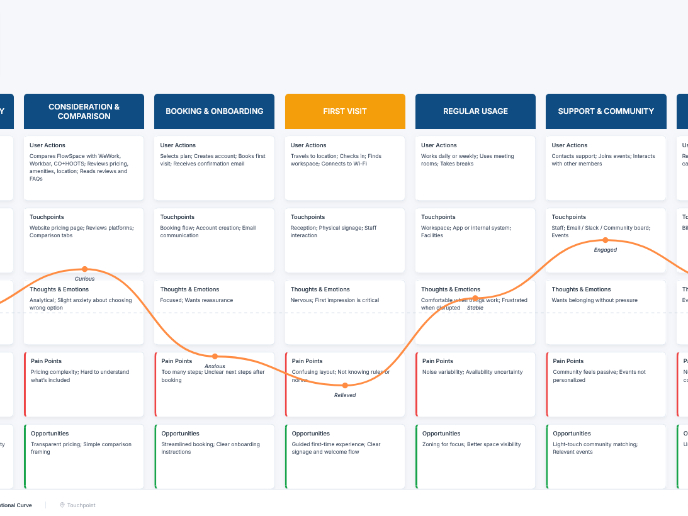
Customer Journey Map — Offsite Co-Working Experience
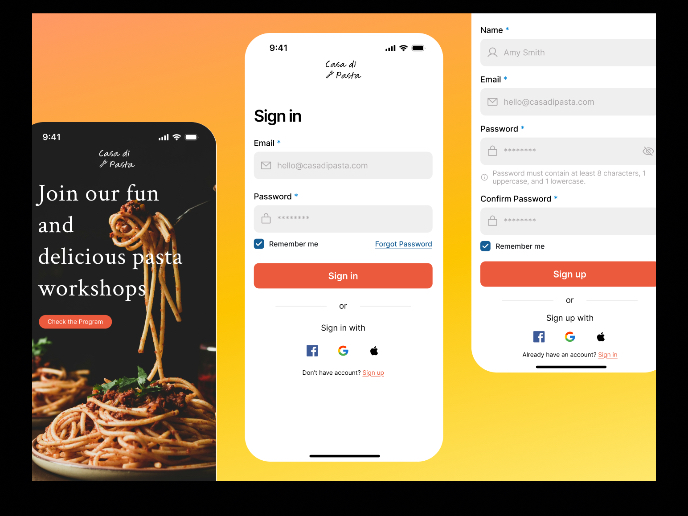
Mobile Onboarding: Casa di Pasta
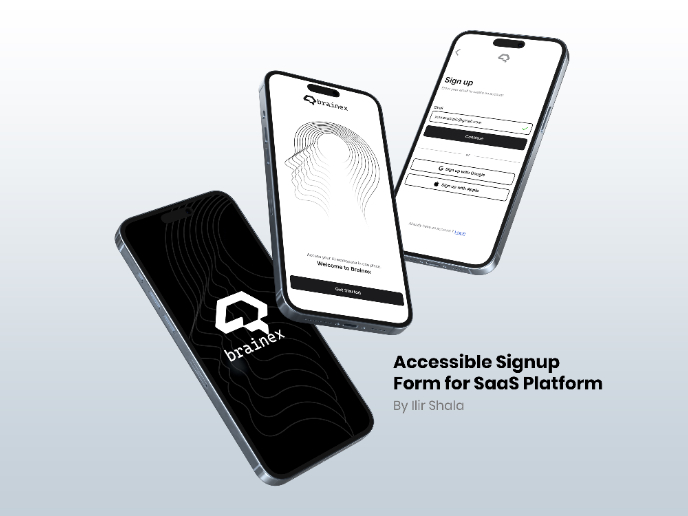
Accessible Signup & Login Experience — Brainex
Accessible Signup Form
Accessible Signup Form
Popular Courses

UX Design Foundations

Design Terminology


