Analyzing quantitative data
Once you've collected numerical data via surveys, polls, or web analytics, you will have a large dataset that can be analyzed with special software (SPSS, JMP, Stata, R, etc.) or simply with a spreadsheet.
Various methods can be applied to gain helpful insights from quantitative data:
- Cross tabulation allows UX practitioners to analyze the relationship between multiple variables and determine patterns, trends, and probabilities within data sets.
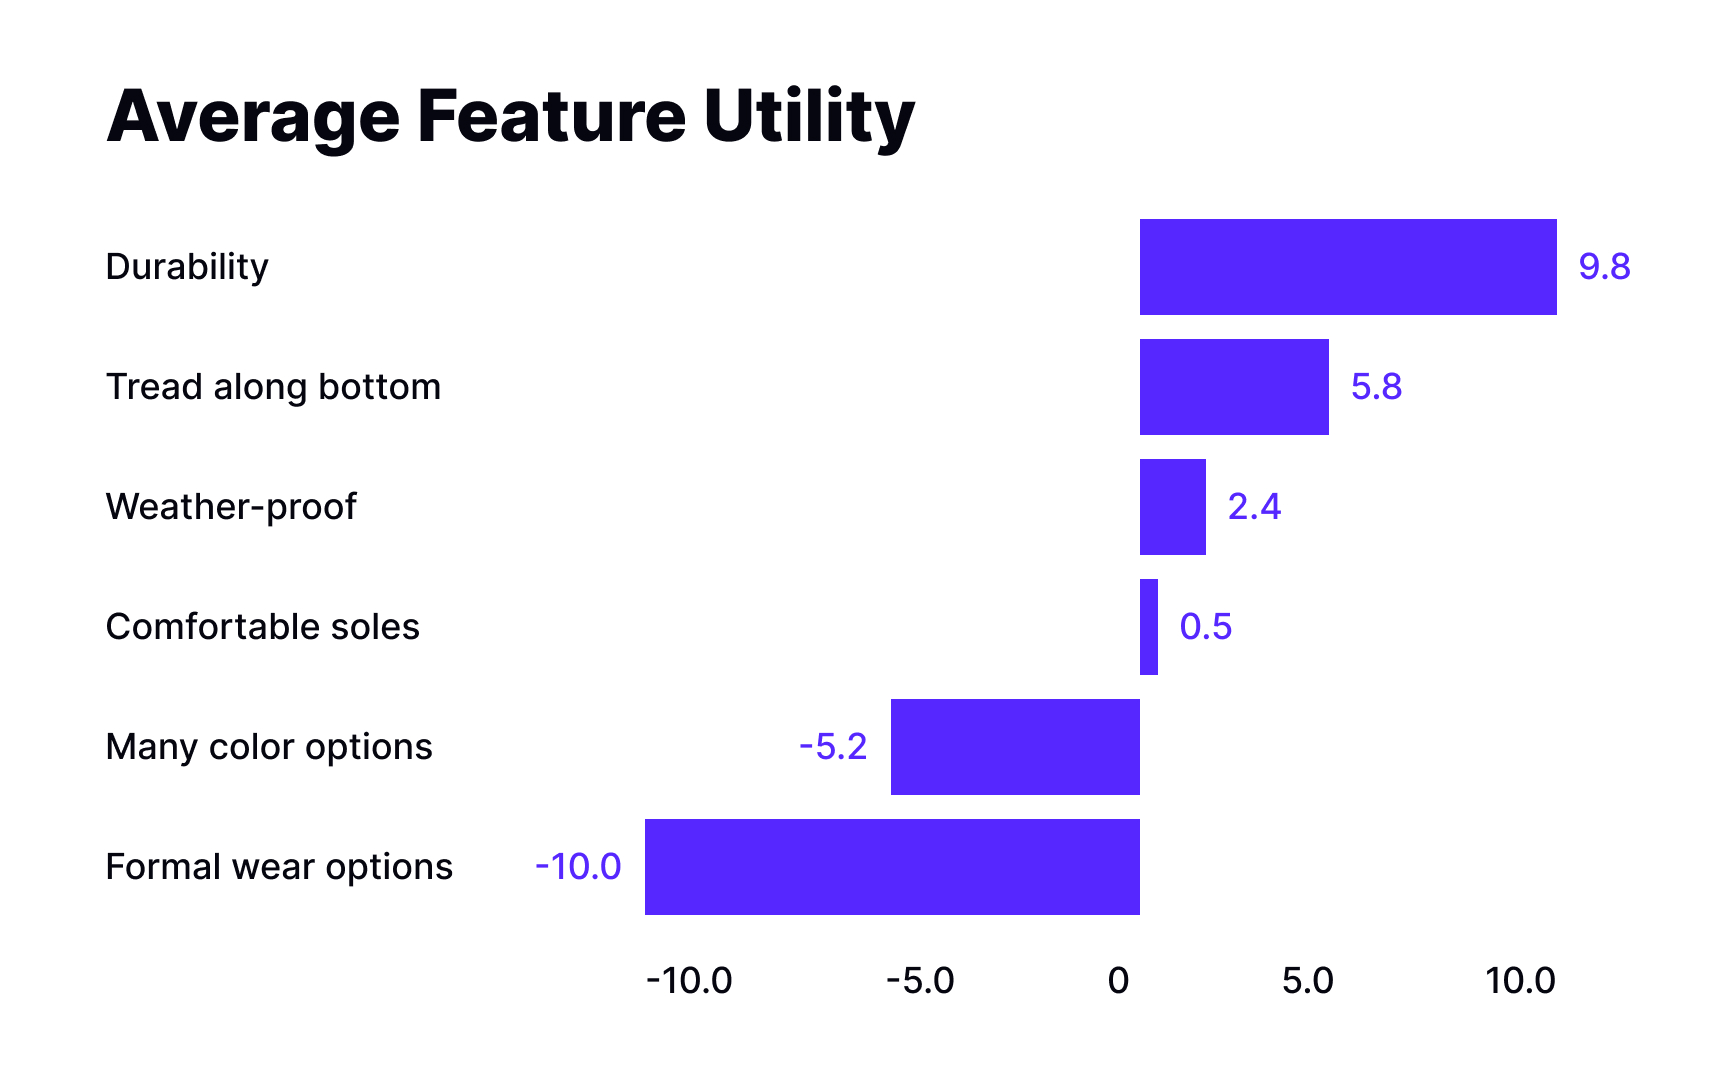
- Max-diff analysis allows measuring the preference/importance score of different items. It's often called the best-worst method as it helps identify what features matter most to your users.
- Conjoint analysis helps identify the optimal combination of features in a product or service, ranking them on a scale from most to least desirable. It consists of factors (e.g., class of service or airline brand) and its levels (economy and business; Southwest Airlines, Delta Air Lines, American Airlines, and United Airlines).
- Gap analysis demonstrates the difference between the desired state and the current state. For example, you can compare the actual and expected state of customer satisfaction.
- Trend analysis shows the change of a value over time and what parameters influence this change.[1]
- Sentiment text analysis helps researchers process users’ feedback from textual data using NLP (Natural Language Processing) tools.
