Communicating and Aligning Across Teams
Transform data into compelling stories that align cross-functional teams and drive organizational success
Cross-team communication challenges often emerge when departments operate with different priorities and professional languages. Data serves as a universal translator, creating bridges between teams by establishing shared understanding through metrics. Organizations struggle with alignment even when frameworks like OKRs are in place, typically due to metrics being pursued for appearances rather than impact, or when dashboards remain isolated within departments. Building compelling data narratives requires tailoring information to specific audiences; executives need high-level impact insights while individual contributors benefit from actionable metrics connected to daily work.
Successful organizations use OKRs as alignment tools that transcend departmental boundaries, providing a shared language for goals and progress. The most effective cross-functional communication balances quantitative metrics with qualitative context, helping stakeholders understand both what happened and why it matters. Organizations that master this alignment process experience faster decision-making, reduced friction, and stronger collective momentum toward strategic objectives.
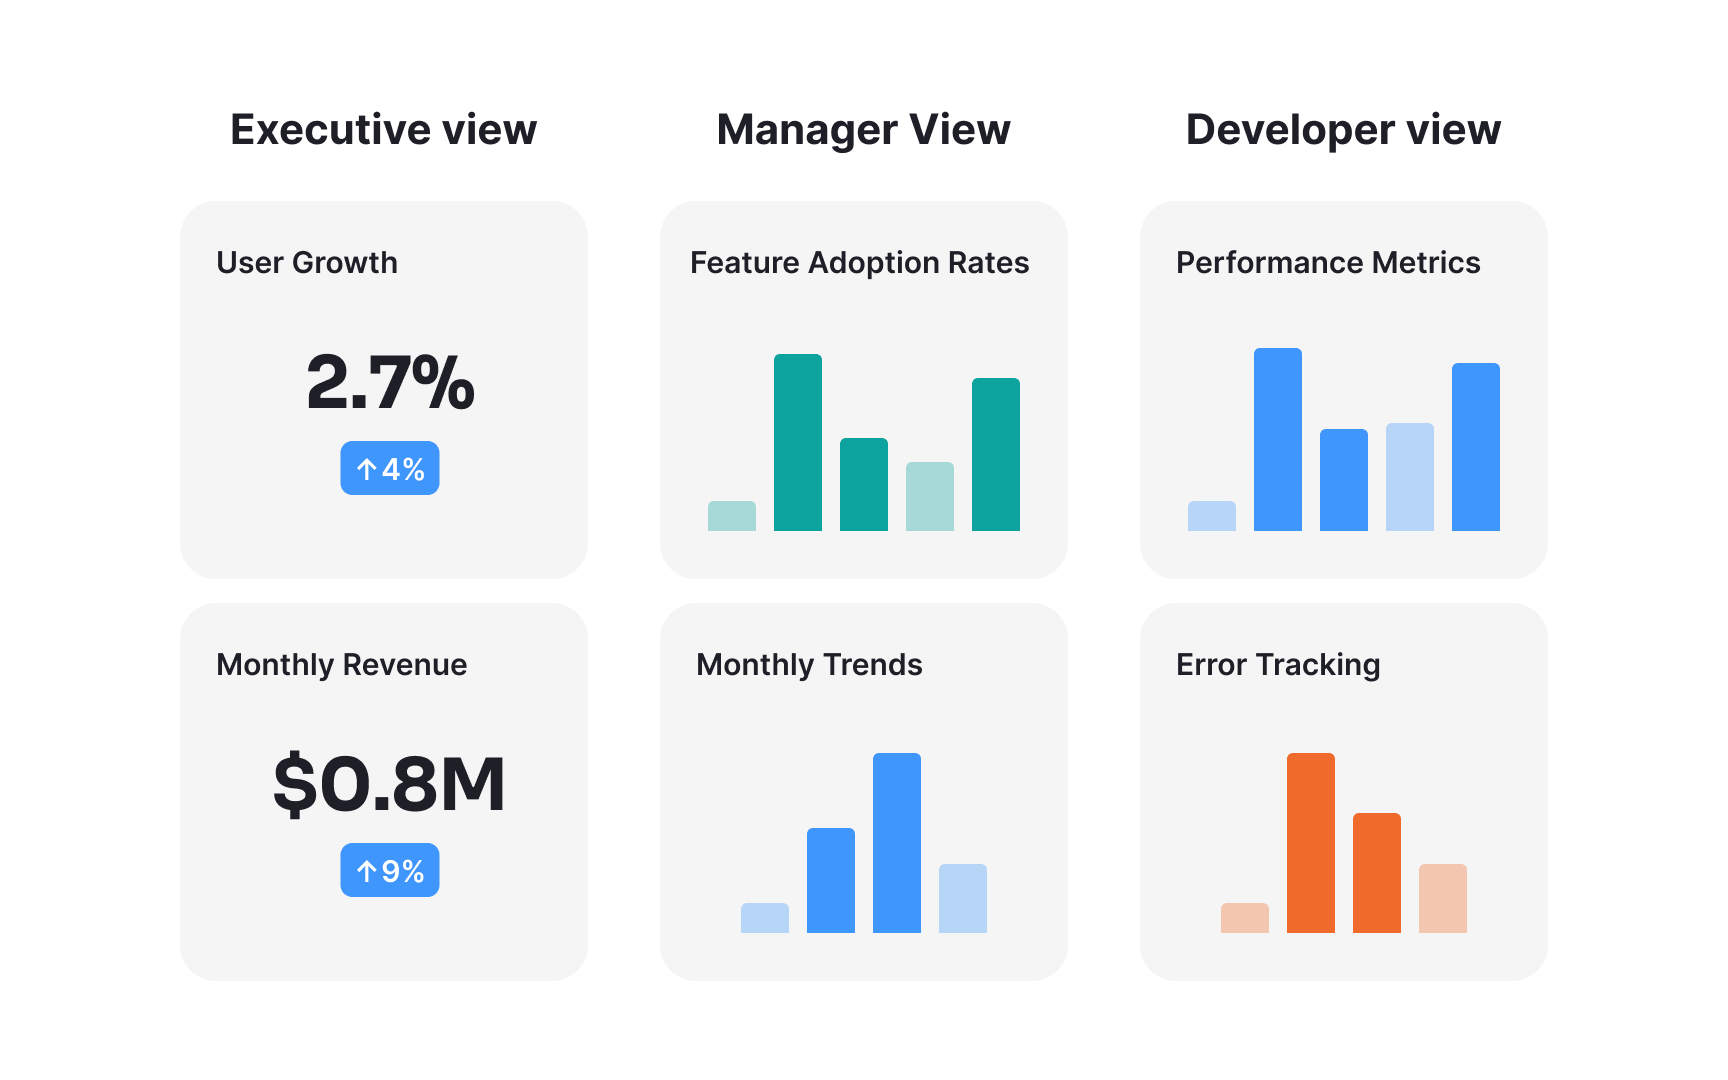
Different stakeholders need different levels of metric detail:
- Executives focus on high-level business outcomes and strategic alignment, requiring concise summaries with clear implications.
- Middle managers need operational metrics that connect their team's work to broader goals. They benefit from both trend data and specific action points to guide their teams.
- Individual contributors like developers, designers, and content writers require granular metrics directly related to their daily work. They need context explaining how their contributions affect team and company goals, with metrics that provide immediate feedback on their efforts.
Metric tailoring builds trust and improves decision-making across organizational levels. It transforms numbers into relevant information that resonates with each audience's priorities and responsibilities.[1] Before sharing metrics, ask yourself: "What decisions will this person make with this information?" Then present only data that directly supports those decisions.
Effective data storytelling transforms raw metrics into compelling narratives that drive action. Here’s how:
- Start by identifying the central insight you want to communicate: focus on one key message rather than presenting every available data point.
- Structure your story with context (why this matters), complication (what changed or needs attention), and resolution (what actions should follow). This narrative arc helps audiences process information in a natural, engaging way.[2]
- Balance quantitative evidence with qualitative context by combining hard metrics with real-world examples or user feedback.
- Acknowledge data limitations and alternative interpretations to build credibility.
- Connect metrics to organizational values and objectives to create emotional resonance that motivates action.
Pro Tip: Always include a "so what?" statement that explicitly connects your data to business impact, ensuring audiences understand why they should care about your metrics.
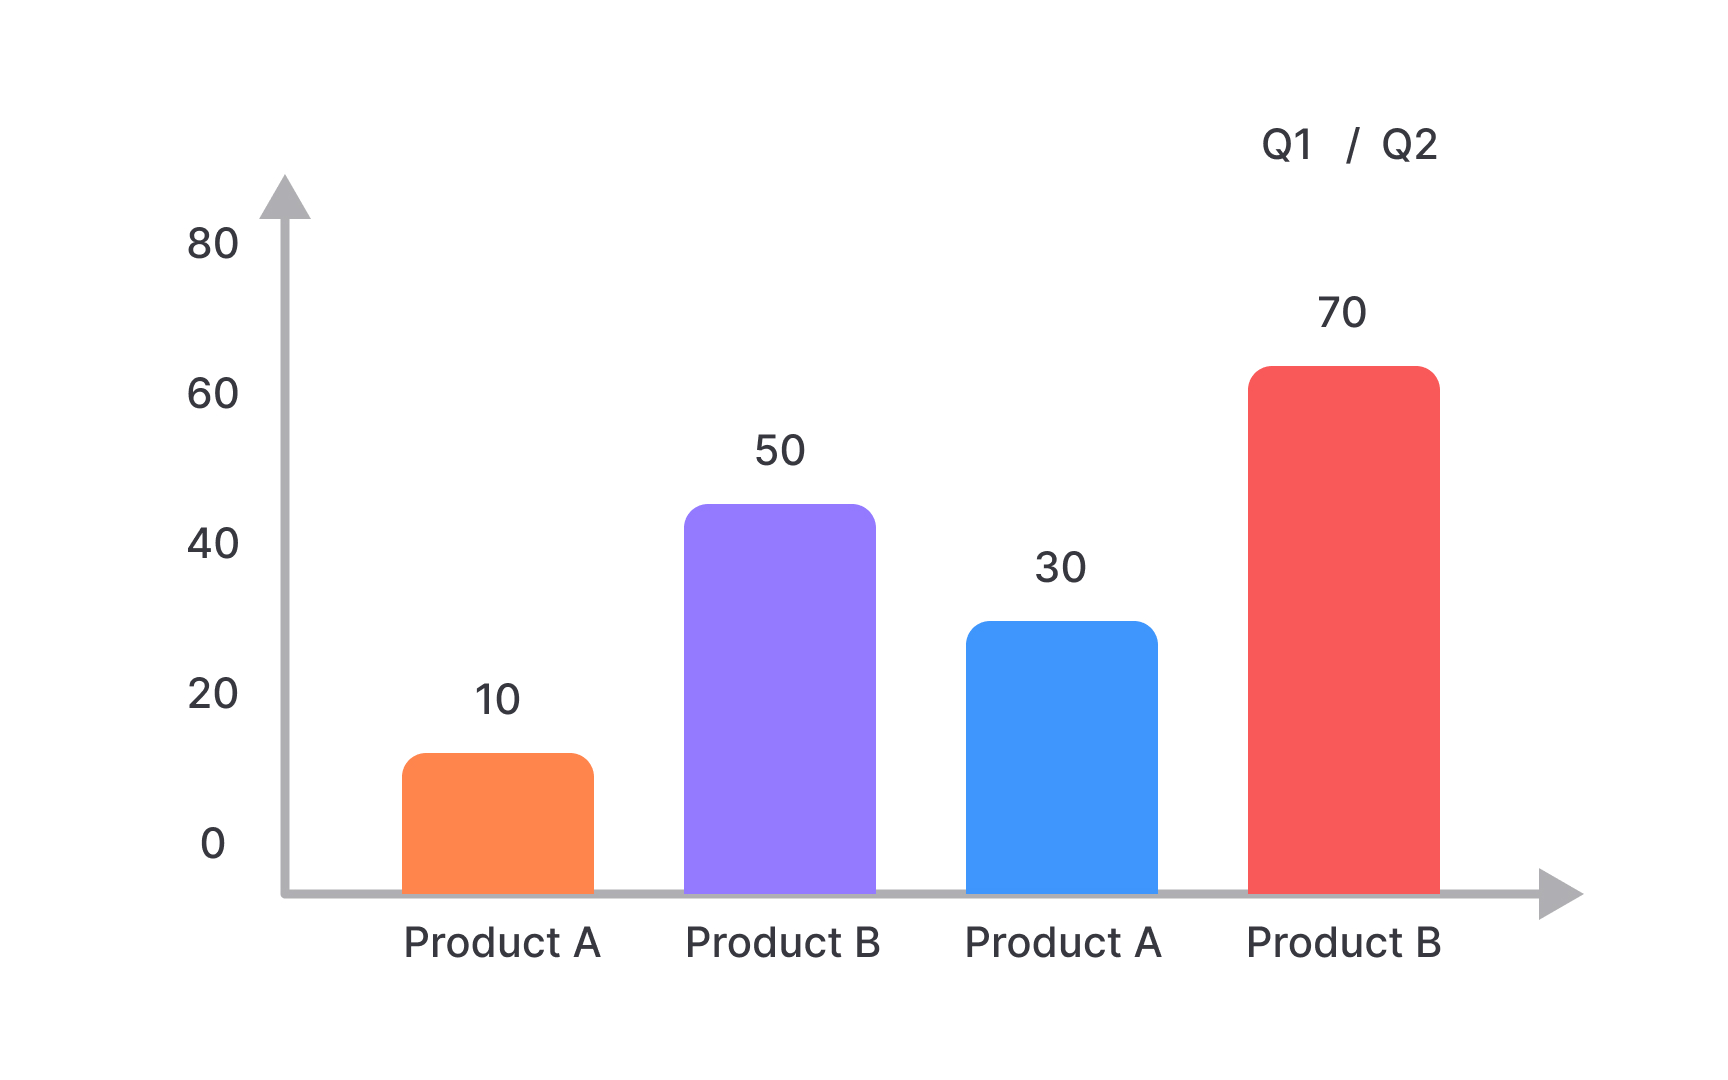
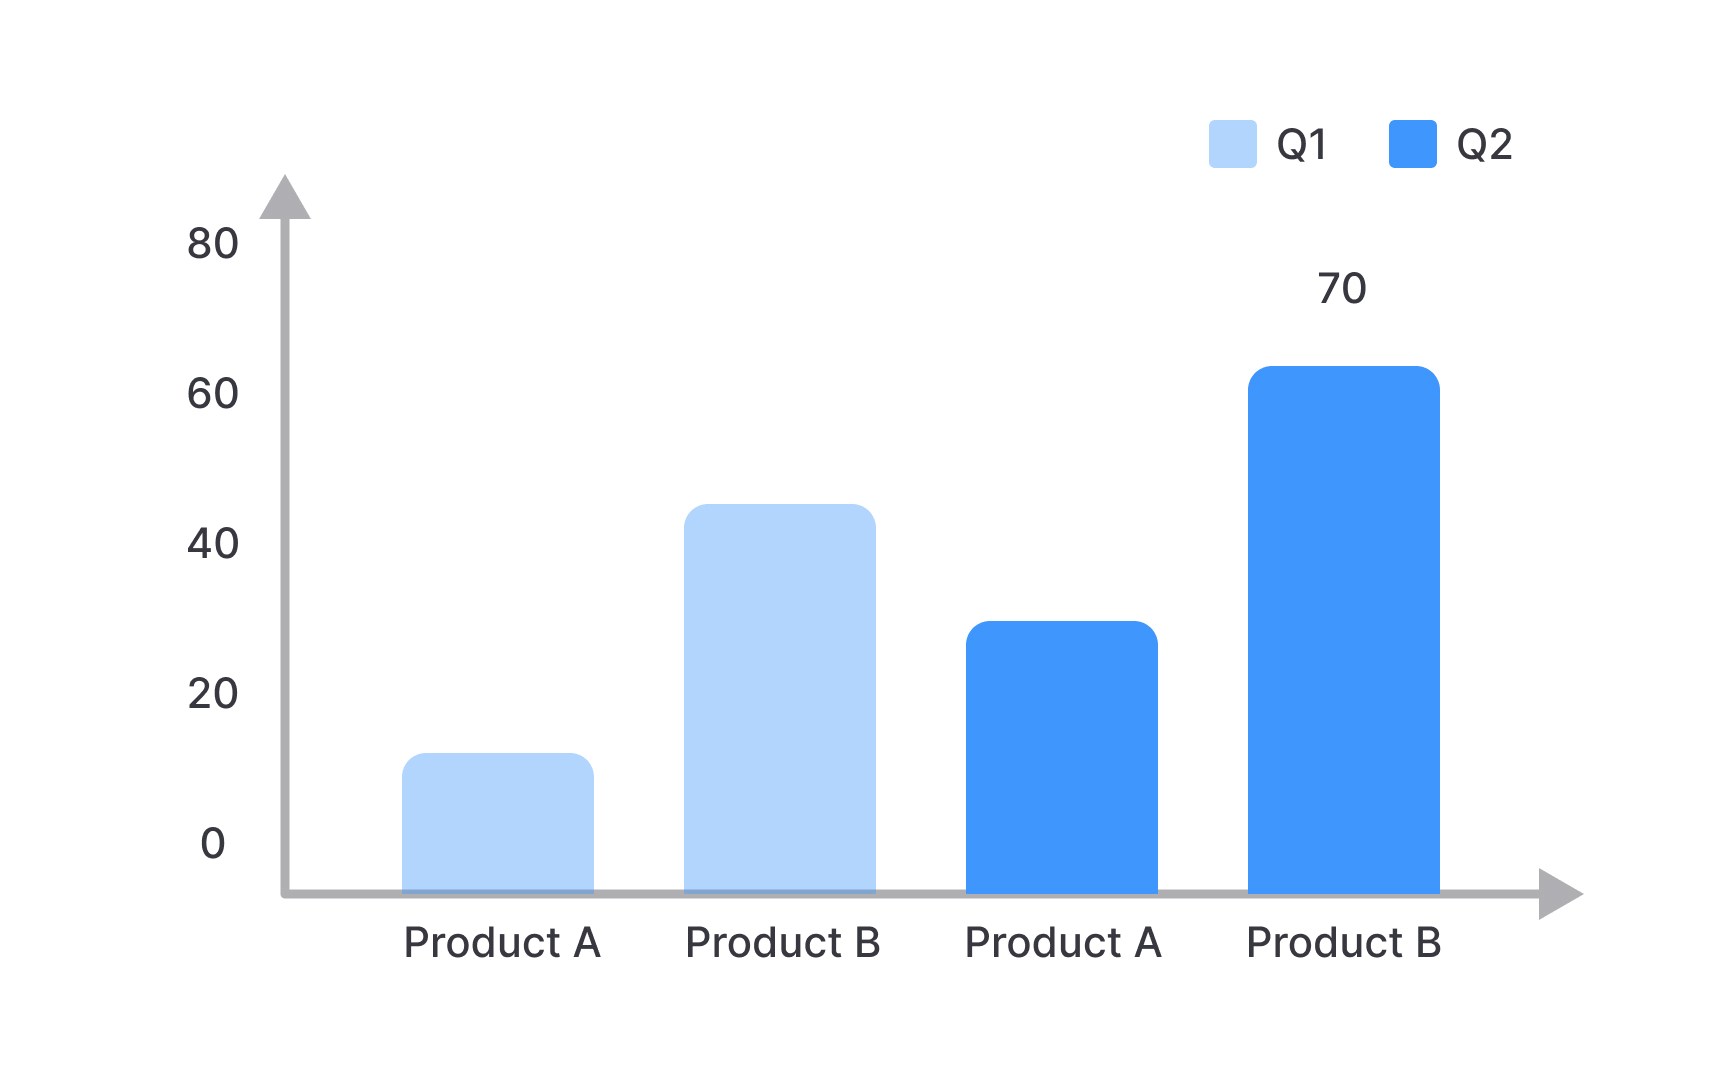
Visual representation significantly impacts how metrics are understood and acted upon. Choose visualization types that match your data's purpose: bar charts for comparisons, line charts for trends, scatter plots for relationships, and pie charts for composition when there are few categories.
Reduce cognitive load by eliminating chart junk and decorative elements that don't convey information. Ensure your visuals have clear titles that state the main insight rather than just describing the chart
Use consistent color schemes and formats across related metrics to help audiences quickly identify patterns and relationships. Color should enhance understanding, not just decorate. Use it to highlight key points, show categories, or indicate performance against targets.
Pro Tip: Test your visualizations by asking someone unfamiliar with your data to explain what they see in five seconds. If they can't identify the main point quickly, simplify your design.
Cross-functional metric forums create structured spaces for teams to align around shared goals and drive collective action. Here’s how to run them:
- Schedule regular sessions with consistent timing and format to establish expectation and accountability.
- Include representatives from all relevant departments to provide diverse perspectives and prevent siloed thinking.
- Assign clear roles during the forum: a facilitator to guide discussion, presenters to explain metrics, and a note-taker to capture decisions and action items.
- Structure the agenda to balance information sharing with collaborative problem-solving.
- Start by reviewing progress on previous action items, then present current metrics with time for questions, and conclude with team-based problem-solving and clear next steps.
- Document decisions, action items, and owners in a shared location accessible to all participants.[3]

Data communication often fails when presenters overwhelm audiences with excessive detail. Focus on insights relevant to your audience's decisions rather than showcasing every available metric.
Beware of confirmation bias, the tendency to highlight only data that supports your existing beliefs. Include contrasting perspectives and acknowledge limitations in your data to build trust and enable more comprehensive understanding.
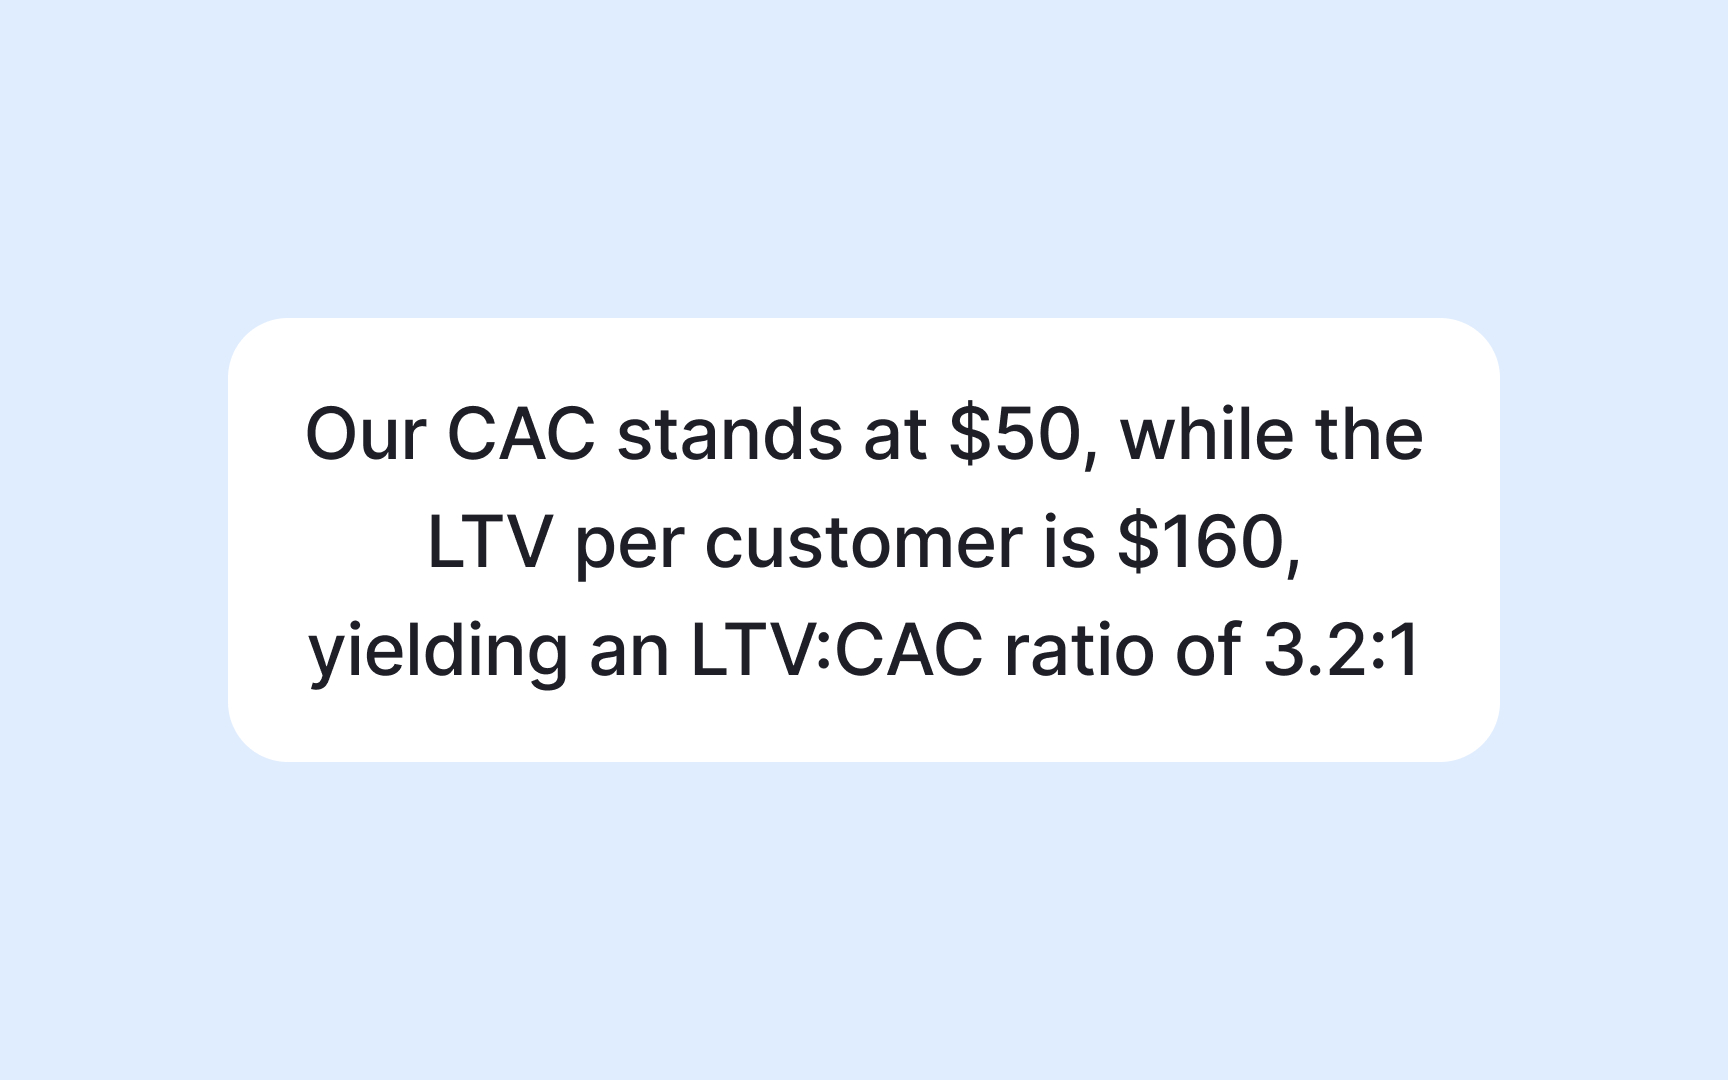
Avoid using technical jargon or acronyms that create barriers for non-specialists. Define terms clearly and use plain language that resonates across functional boundaries. Remember that different teams may interpret the same terms differently, leading to misunderstandings that derail alignment.
Cross-functional conflicts often arise from competing priorities or resource constraints. For example, when engineering pushes for technical improvements while product demands new features, data becomes a neutral arbiter that can align teams around shared objectives.
Start by identifying the core business goal both teams ultimately serve. Then jointly define metrics that reflect this shared purpose rather than department-specific targets. This shifts the conversation from subjective opinions to objective evidence about what will best serve users and the business.
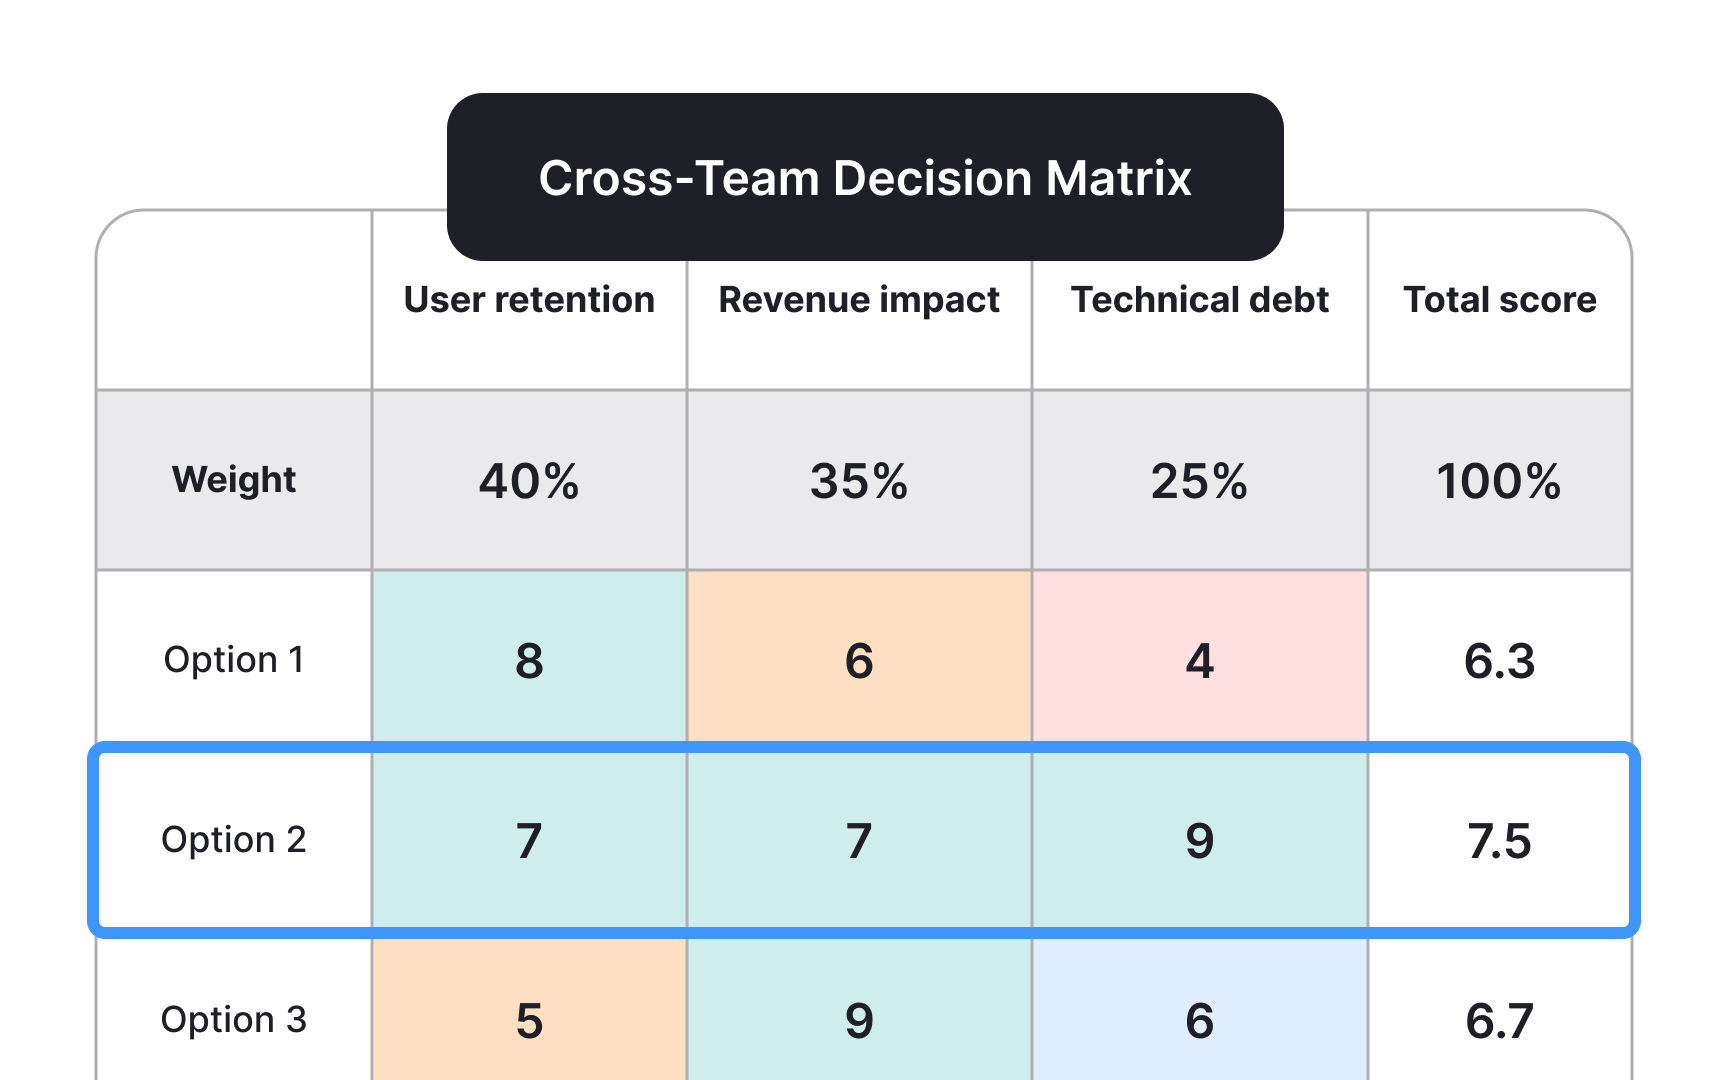
Create a collaborative decision matrix that weighs different options against agreed-upon metrics. Visualize potential tradeoffs and impacts across departments to facilitate more balanced decision-making and reduce territorial thinking. Document decisions and revisit results to build trust in the process.
Metrics only create value when they drive meaningful action. Many organizations suffer from "analysis paralysis" which involves collecting abundant data but struggling to translate insights into concrete decisions and changes in behavior.
To avoid this, establish a clear decision framework that defines thresholds for different types of actions. For example, specify when a metric requires monitoring, investigation, or immediate intervention. This creates consistency in how teams respond to data signals.
For each key metric, document not just what it measures but what specific actions different stakeholders should take when it changes. Create simple decision trees that guide teams through appropriate responses to metric shifts, connecting measurement directly to behavior change.
References
- McKinsey SCR Framework: What It Is & How To Use It | Management Consulted
- How to Align Teams Using OKRs: 5 Easy Tips - Peoplebox.ai | Peoplebox.ai
Top contributors

Topics
From Course

Share


