🍲 Meal Delivery Survey Design
This quantitative survey is purpose-built in Google Forms to gather reliable, actionable data about how Stockholm residents use on-demand meal-delivery apps. The instrument is structured in four logically sequenced sections—Demographics, Behavior, Preferences, and Pain Points—each introduced with a short, friendly description to orient respondents. All 20 questions are closed-ended (multiple choice, checkboxes, Likert scales, or linear scales) to streamline analysis and keep completion time under four minutes.
I wanted to implement skip-logic rules to tailor follow-ups only to relevant participants (e.g., non-users are routed past usage questions) but decided in the end to not use it because the UX of creating forms in Google Forms is such a hassle. But if I chose to use it it would for sure boost data quality while respecting respondent time.
Language is intentionally plain and neutral to avoid bias or double-barreled phrasing, and each item maps directly to a research goal or hypothesis documented in the rationale. The form is fully responsive, ensuring an equally smooth experience on mobile and desktop, and anonymity assurances are featured up front to build trust and maximize honest feedback.
UX Artifacts
- 'Deep Research' (GhatGPT)
- Planning the Survey (Google Sheets)
- The Questionnaire (Google Forms)
- Responses (Google Sheets)
Process
1 . Define the research goals
“Deep Research” (ChatGPT) crystallises the problem space, target audience and hypotheses.
2 . Operationalise the study
“Planning the Survey” (Sheets) captures sampling frame, recruitment channels, timeline and success metrics.
3 . Create the instrument
“The Questionnaire” (Google Forms) is the actual instrument respondents will see.
4 . Collect & store raw data
“Responses” (Sheets) stores each submission in structured form.
---
Because each artifact is produced for and during the UX-survey process, they’re all considered UX-research deliverables.
A couple of gaps you might still add
- Pilot-test summary: quick notes on feedback you gathered from a dry run and the tweaks you made before launch.
- Analysis / insights report: after cleaning the “Responses” sheet, document key findings, design implications and next steps for stakeholders.
Key Deliverables
- Competitor & trend audit – highlights market share, feature differentiators, and emerging UX patterns in Stockholm.
- Knowledge-gap analysis – pinpoints unanswered questions about user priorities, non-user barriers, and cross-device behaviors.
- Google Forms-ready survey – 20 closed-ended questions, divided into Demographics, Behavior, Preferences, and Pain Points. Mobile- and desktop-optimized, with skip logic to keep responses relevant and completion time under four minutes.
- Design rationale – explains how each question ties to research goals and hypotheses, ensuring neutrality and statistical validity.
The finished survey will capture actionable quantitative data to prioritize UX improvements—ranging from delivery-time accuracy and app usability to eco-friendly practices—helping Stockholm’s meal-delivery platforms align more closely with real user needs.
---
P.S Big shout to Nick Qurle who created this Glassmorphism 2.0 effect that I used for the cover image. I really love the texture. I modified it a little bit to give it a 'milky' vs. clear glass feeling.
Reviews
1 review
Hi Jonas!✨
You've really shown a deep understanding of UX research methodology and a systematic approach that's absolutely foundational for making strong design decisions.
I particularly love how meticulously you thought through the survey structure in Google Forms. Breaking it down into "Demographics, Behavior, Preferences, and Pain Points" with those friendly introductions is a brilliant move for enhancing the respondent's own user experience. And sticking to closed-ended questions like multiple choice, checkboxes, and Likert scales really speaks to your commitment to gathering high-quality, easily analyzable quantitative data. That's super smart!
Your attention to detail, like using plain and neutral language to avoid bias, and directly linking each question to your research goals and hypotheses, really highlights your dedication to data validity. And the fact that you even mentioned wanting to use "skip-logic" to boost data quality and respect respondent time, even though you decided against it due to Google Forms' limitations, totally shows your understanding of usability principles and research efficiency. That's the mindset of a true researcher!
I also want to specifically point out how clearly you laid out the entire research process, from defining goals to data collection, and presented all your artifacts as UX research deliverables. This truly demonstrates your systematic approach and your knack for project organization. And, of course, it's fantastic to see you paid attention to the form's responsiveness for both mobile and desktop – that's crucial for accessibility and overall ease of use. Well done!
You might also like
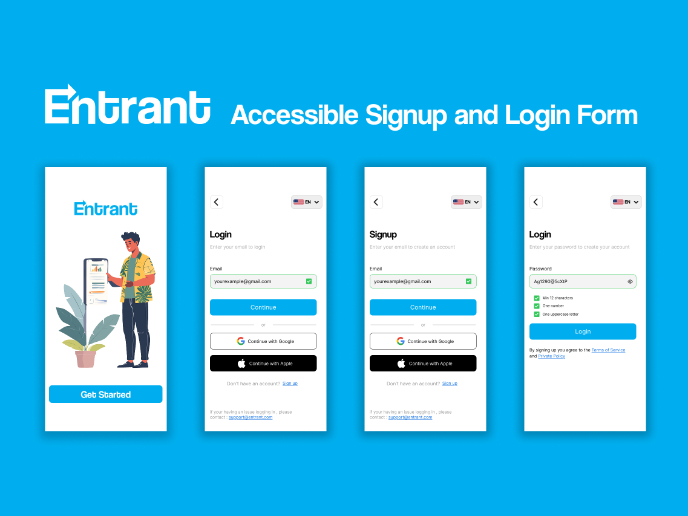
Entrant Accessible Signup and Login Forms
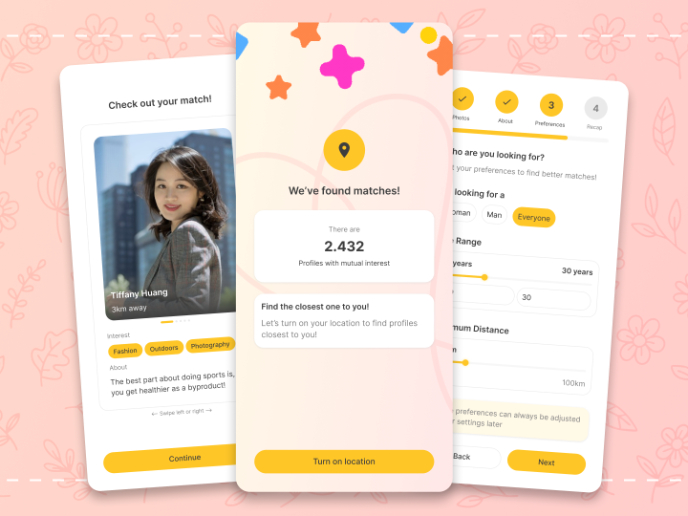
A/B Testing for Bumble's Onboarding Process
Dark mode Main page
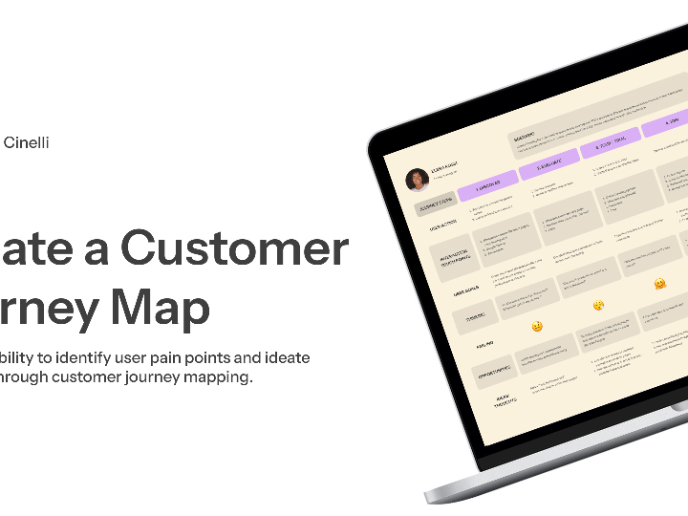
CJM x Mindspace case study - Ester Cinelli
LUMÉRA - Checkout Flow

Tripit's Login and Sign Up Flow
User Research Courses

Ethical & Responsible Product Design

Introduction to Product Management


