Lead time and throughput in Kanban
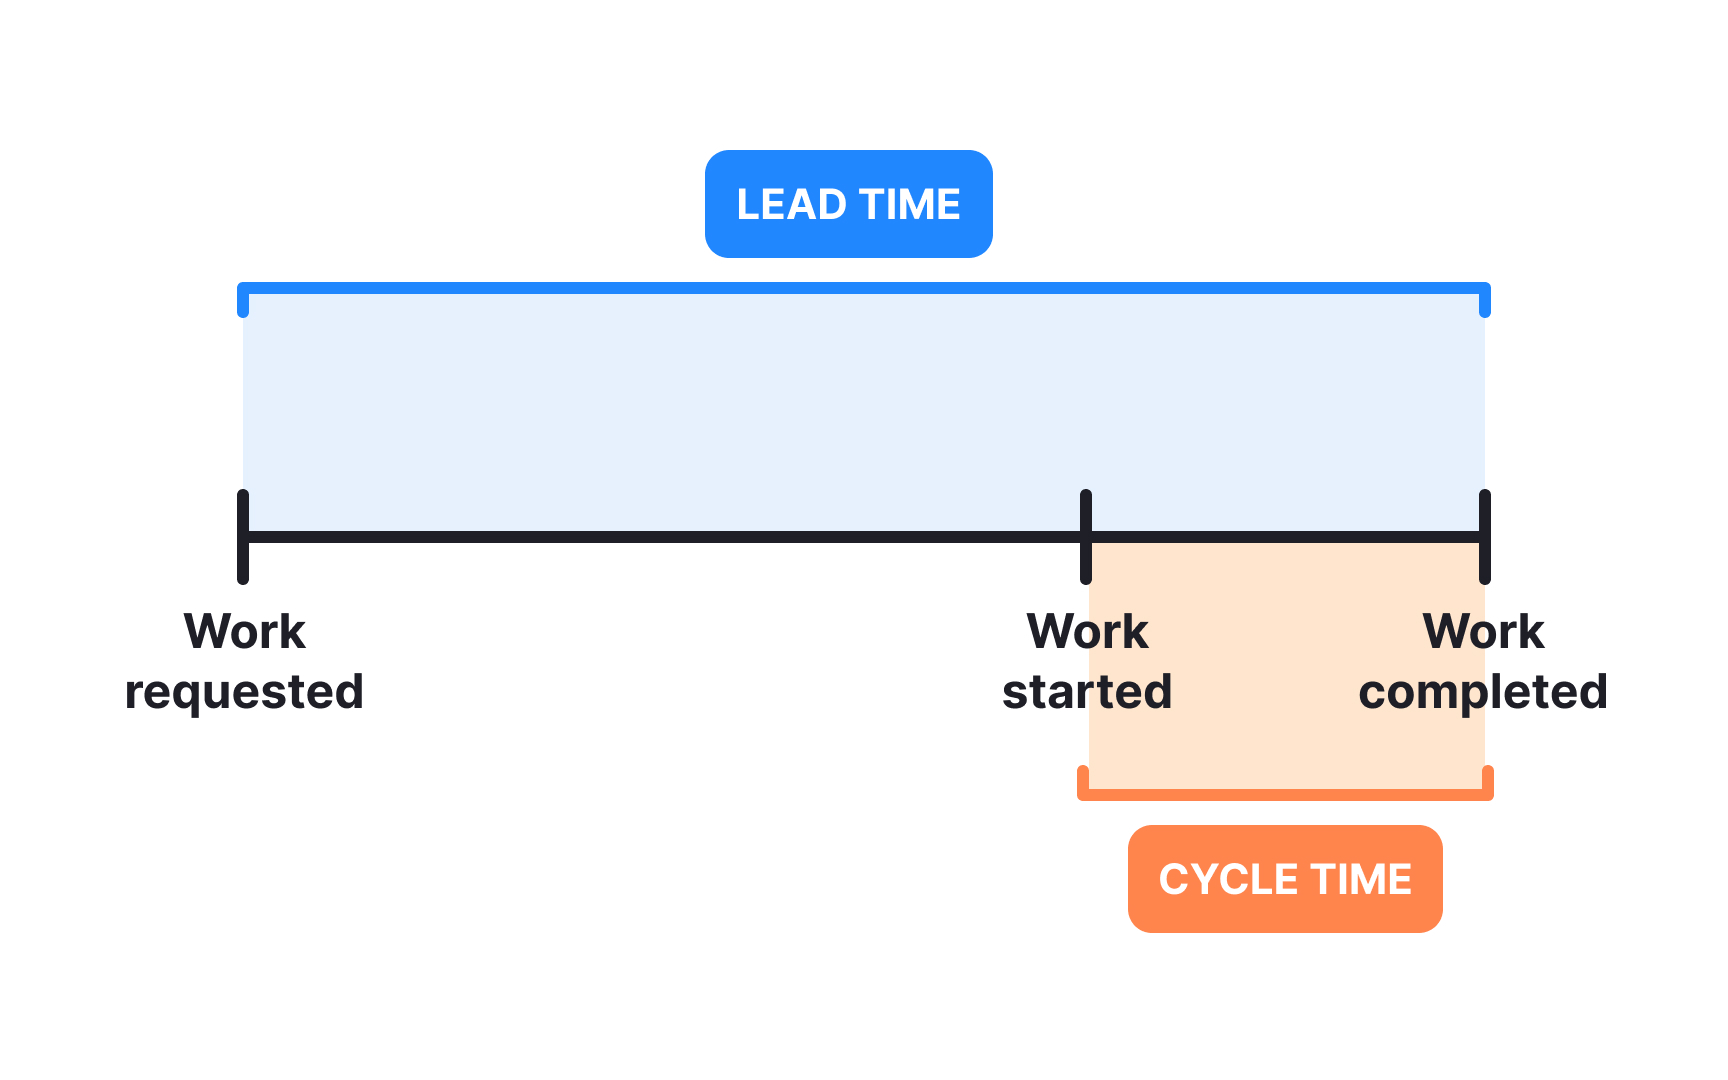
Lead time captures customers’ waiting experience, measuring from request to completion, including all queue time. While cycle time focuses on team efficiency, lead time reveals the responsiveness of the entire value stream. If a feature request waits 6 weeks in the backlog before 3 days of development, the cycle time is 3 days, but the lead time is 6 weeks. This difference shows why measuring only active work time can hide delays in customer experience. Throughput counts completed items per time period (usually weekly), providing a simple measure of team output. Unlike velocity, throughput doesn't require estimation. It simply counts finished items, making it reliable for forecasting.
Teams use lead time and throughput together to improve workflows. High lead times with normal throughput indicate backlog prioritization issues, while decreased throughput signals problems in the active workflow. Historical throughput helps with forecasting. Teams can predict completion dates by looking at past rates rather than estimating each item individually, providing stakeholders with realistic expectations.
Pro Tip: Track the ratio between lead time and cycle time to find delivery delays. A high ratio shows items waiting too long before work begins.
