Cumulative flow diagrams in Scrum
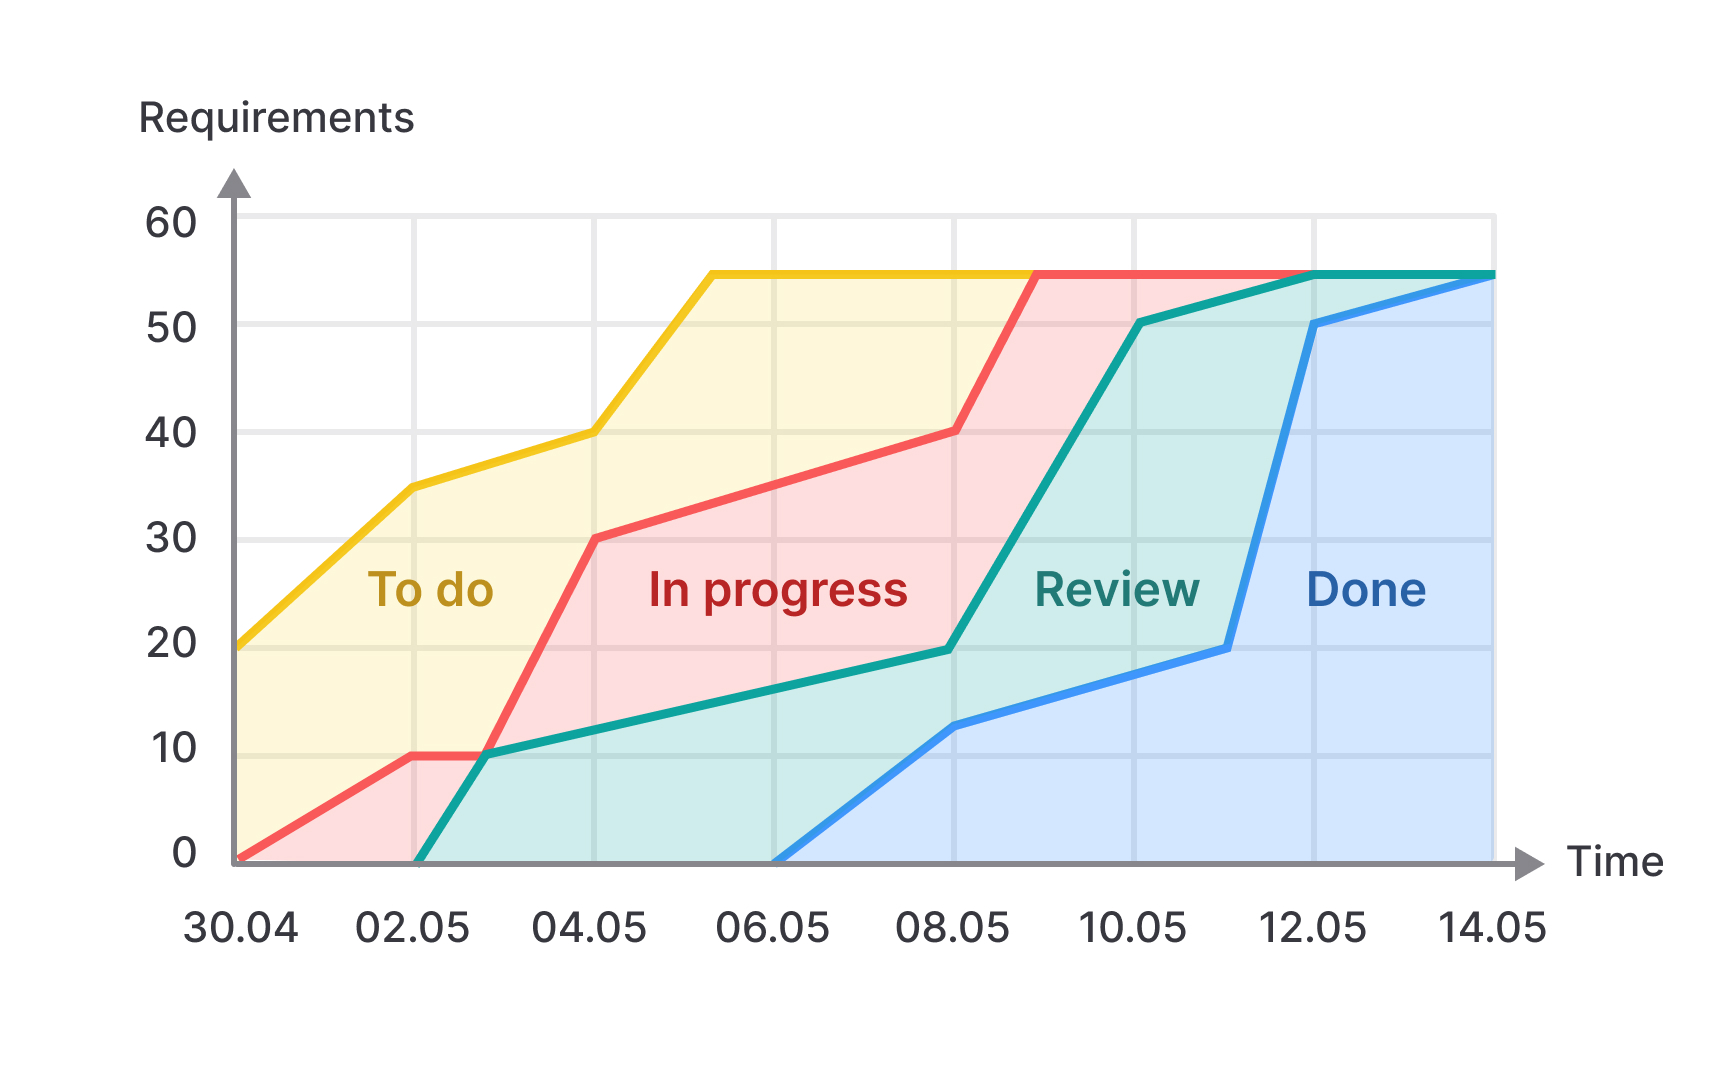
Cumulative Flow Diagrams (CFDs) show how work moves through a system over time, creating a powerful tool for Scrum teams. Each colored band shows a workflow state like "To Do," "In Progress," "Review," and "Done," revealing how work builds up and flows between states. The vertical space between bands at any point shows the work in progress (WIP) for that state. Widening bands show accumulating work, potentially revealing bottlenecks where items are piling up. The ideal CFD shows parallel bands moving upward together, indicating smooth flow through the system. CFDs reveal cycle time (how long work takes to move through the process) by measuring the horizontal distance between when work enters the system and when it's completed. Growing horizontal distances show slowing delivery, while consistent distances suggest stable, predictable flow.
Unlike single-point measurements, CFDs provide context about how work patterns change over time. They help teams identify exactly where the flow breaks down, whether in early planning stages, during development, or in final testing and review. Teams review CFDs during Sprint Retrospectives to find system-wide patterns beyond individual stories. Questions like "Why is our 'In Review' band getting wider?" lead to meaningful process improvements that address root causes rather than just symptoms.
Pro Tip: When looking at CFDs, watch for sudden changes in bandwidth. These often show process changes, staffing shifts, or external dependencies that might not show up in other metrics.
