Gantt Chart
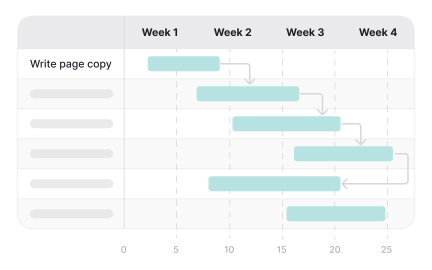
A Gantt chart is a timeline-based project planning tool that visualizes tasks, dependencies, and deadlines across teams or deliverables.

What is Gantt Chart?
Your project planning lacks visual clarity because task lists and spreadsheets don't show dependencies and timeline relationships, leading to scheduling conflicts, missed deadlines, and team confusion about what needs to happen when for successful project completion.
Most teams try to manage complex projects through static lists and verbal communication without visual timeline representation, missing critical dependencies and resource conflicts that become visible only when visualized across time with clear relationships.
A Gantt chart is a horizontal bar chart that visualizes project schedules by showing tasks along a timeline with dependencies, durations, and resource assignments, creating clear visual representation of how work flows through time to achieve project objectives.
Teams using Gantt charts effectively achieve 50% better on-time delivery, 40% fewer resource conflicts, and significantly improved stakeholder communication because everyone can see project status and dependencies at a glance rather than parsing complex spreadsheets.
Think about how construction projects use Gantt charts to coordinate hundreds of contractors and dependencies, or how software teams visualize release schedules to identify critical paths and potential delays before they impact delivery.
Why Gantt Charts Matter for Project Success
Your project coordination suffers because team members don't understand how their work affects others or when dependencies will be ready, leading to idle time, rushed work, and cascading delays when critical path activities slip without visibility.
The cost of poor project visualization compounds through every miscommunication and missed dependency. You waste resources on premature work, create bottlenecks through poor sequencing, miss deadlines, and frustrate teams when unclear timelines create constant firefighting.
What effective Gantt charts deliver:
Better project predictability and on-time delivery because visual timelines reveal critical paths and potential delays before they impact final delivery rather than discovering problems when it's too late.
When projects use Gantt charts properly, teams proactively address risks rather than reacting to surprises that could have been predicted through timeline visualization.
Enhanced resource optimization and capacity planning through visual representation of who's working on what when, preventing overallocation and identifying slack time for better utilization.
Improved stakeholder communication and alignment because Gantt charts create shared understanding of project status and timelines rather than conflicting mental models about progress.
Stronger dependency management and risk mitigation as visual representation makes relationships clear rather than hidden connections that surprise teams when predecessor tasks slip.
More effective project control and adaptation through easy visualization of impact when changes occur rather than guessing how adjustments affect overall timeline.
Advanced Gantt Chart Visualization Techniques
Once you've mastered basic Gantt charts, implement sophisticated project visualization and optimization techniques.
Resource-Leveled Gantt Optimization: Use automated resource leveling rather than manual adjustment, optimizing schedules based on capacity constraints while maintaining dependencies.
Monte Carlo Simulation Integration: Add probability ranges to Gantt charts rather than single-point estimates, showing likelihood of different completion dates based on risk analysis.
Agile-Gantt Hybrid Visualization: Combine sprint planning with Gantt timelines rather than choosing between methodologies, enabling both flexibility and long-term visibility.
Portfolio Gantt Coordination: Create master Gantt charts across multiple projects rather than isolated schedules, identifying resource conflicts and dependencies between initiatives.
Step 1: Define Complete Work Breakdown Structure (Day 1-2)
List all tasks required for project completion with clear deliverables rather than high-level phases without actionable detail that enables accurate scheduling.
This creates Gantt foundation based on comprehensive understanding rather than partial task lists that miss critical work and create timeline surprises.
Step 2: Estimate Task Durations and Add Buffer (Day 2-3)
Assign realistic time estimates including contingency rather than optimistic durations without risk buffer, ensuring schedules remain achievable when normal variations occur.
Focus estimation on effort-based durations rather than calendar time initially, then convert based on resource availability and allocation percentages.
Step 3: Identify and Map All Dependencies (Day 3-4)
Document which tasks must complete before others can start rather than assuming parallel work without constraint analysis, revealing true critical path.
Balance comprehensive dependency mapping with practical simplification to ensure charts remain readable rather than becoming tangled webs of relationships.
Step 4: Assign Resources and Check Capacity (Day 4-5)
Allocate people to tasks while checking for overallocation rather than assuming infinite capacity, ensuring realistic schedules based on actual availability.
Step 5: Optimize Schedule and Communicate Plan (Week 2)
Adjust task sequencing and resources to shorten timeline where possible rather than accepting initial schedule without optimization attempts.
This ensures Gantt charts drive efficiency rather than just documenting whatever schedule emerges without strategic planning.
If Gantt charts don't improve project success, examine whether they're living documents rather than one-time planning artifacts without ongoing updates.
The Problem: Gantt charts that become too detailed and complex to understand, defeating their purpose of creating clear visual communication about project timelines.
The Fix: Create multiple levels of detail rather than one comprehensive chart, showing executives summary views while teams see detailed task assignments.
The Problem: Static Gantt charts that don't reflect project reality as work progresses, becoming obsolete planning artifacts rather than living management tools.
The Fix: Establish regular update cycles and automate where possible rather than manual maintenance, ensuring charts reflect current reality rather than original plans.
The Problem: Over-reliance on Gantt charts for projects with high uncertainty, where detailed planning creates false confidence rather than acknowledging unpredictability.
The Fix: Use Gantt charts for known work while combining with agile approaches for uncertain elements, leveraging visualization benefits without forcing false precision.
Create Gantt chart approaches that enhance project clarity and coordination rather than adding planning overhead without improving delivery success.
Recommended resources
Courses

HTML Foundations


Mentorship Mastery


Design Thinking