UX Research Reporting
Learn how to create impactful UX research reports that effectively communicate findings, insights, and recommendations to stakeholders
Do people even read UX research reports these days? If they are well-drafted and meaningful, yes. Research reports can be a great way to orient team members and stakeholders on the most significant details of your study.
Writing reports that keep the audience in mind, keep research findings concise, and present actionable insights will be useful to all of the stakeholders on a project.
The most obvious purpose of a
It can also function as a cornerstone for future studies and can be referred back to at any point in time. However, not all research reports turn out to be useful. For reports to be effective, ensure that they are enjoyable, informative, concise, and actionable.[1]
Pro Tip: Avoid using technical jargon in your UX research report. It should be easy to understand even by people who do not have UXR expertise.
Even the best UXR studies with rock-solid
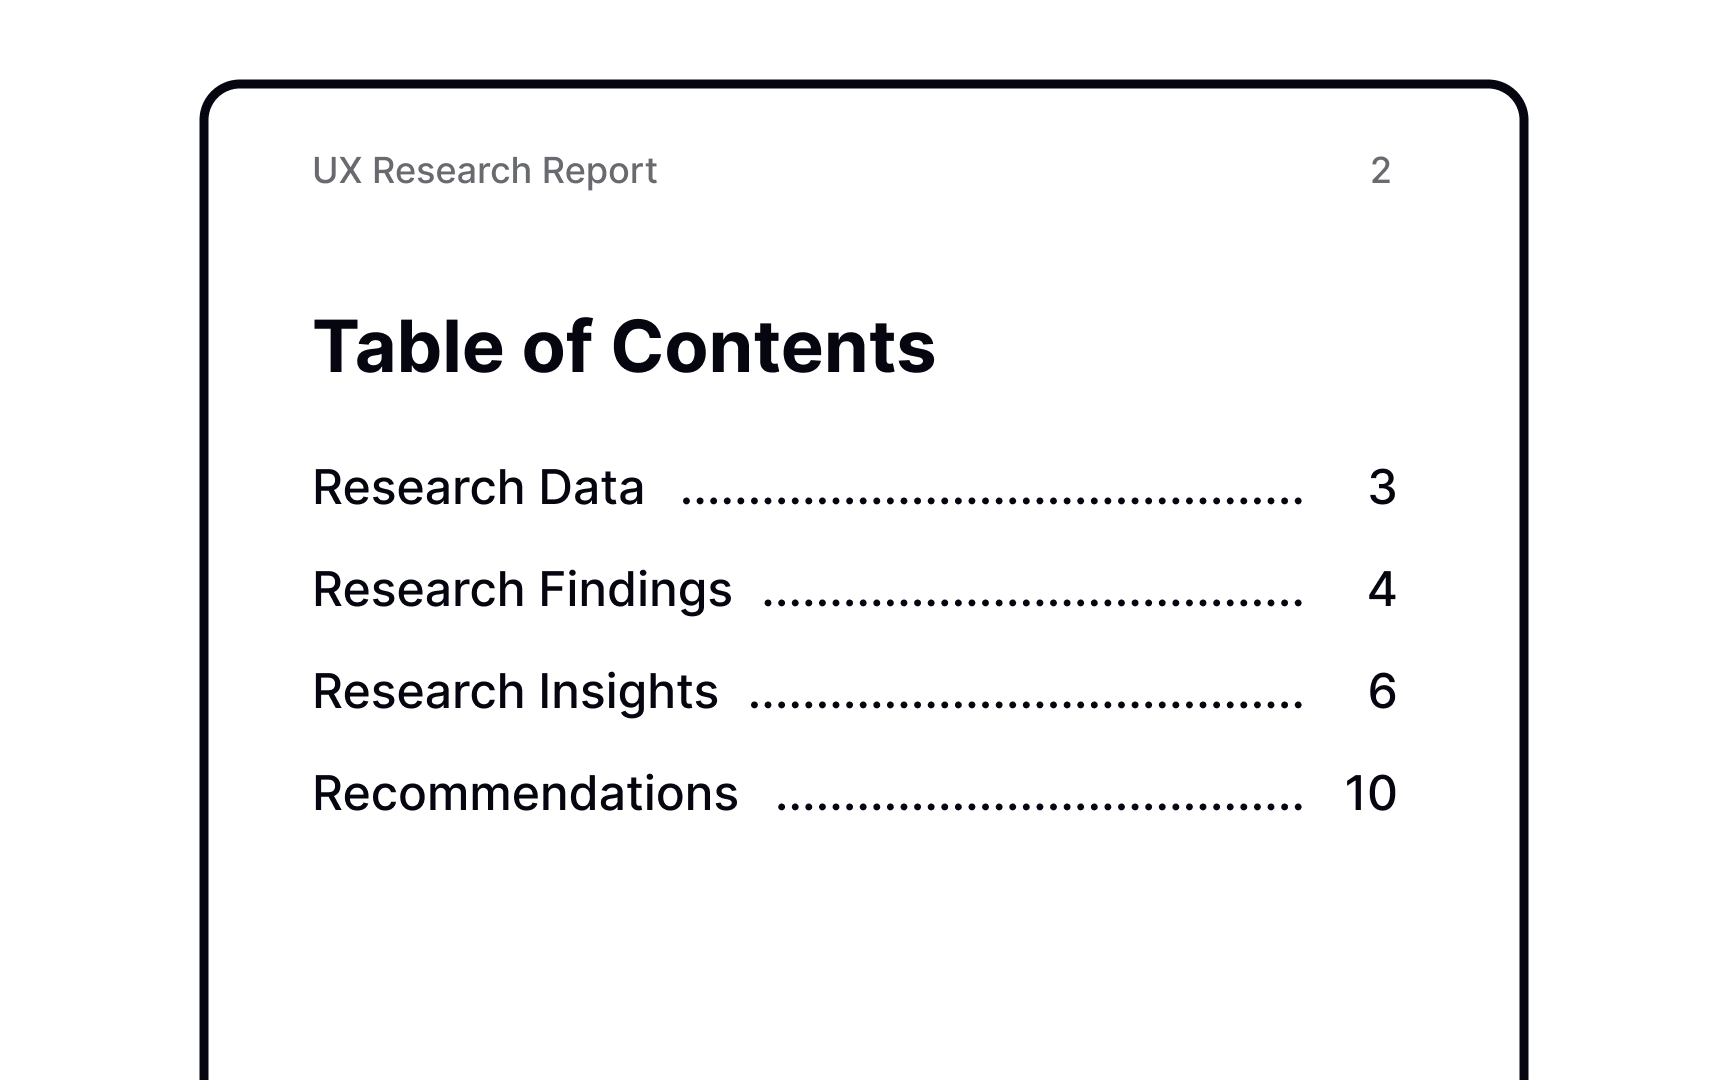
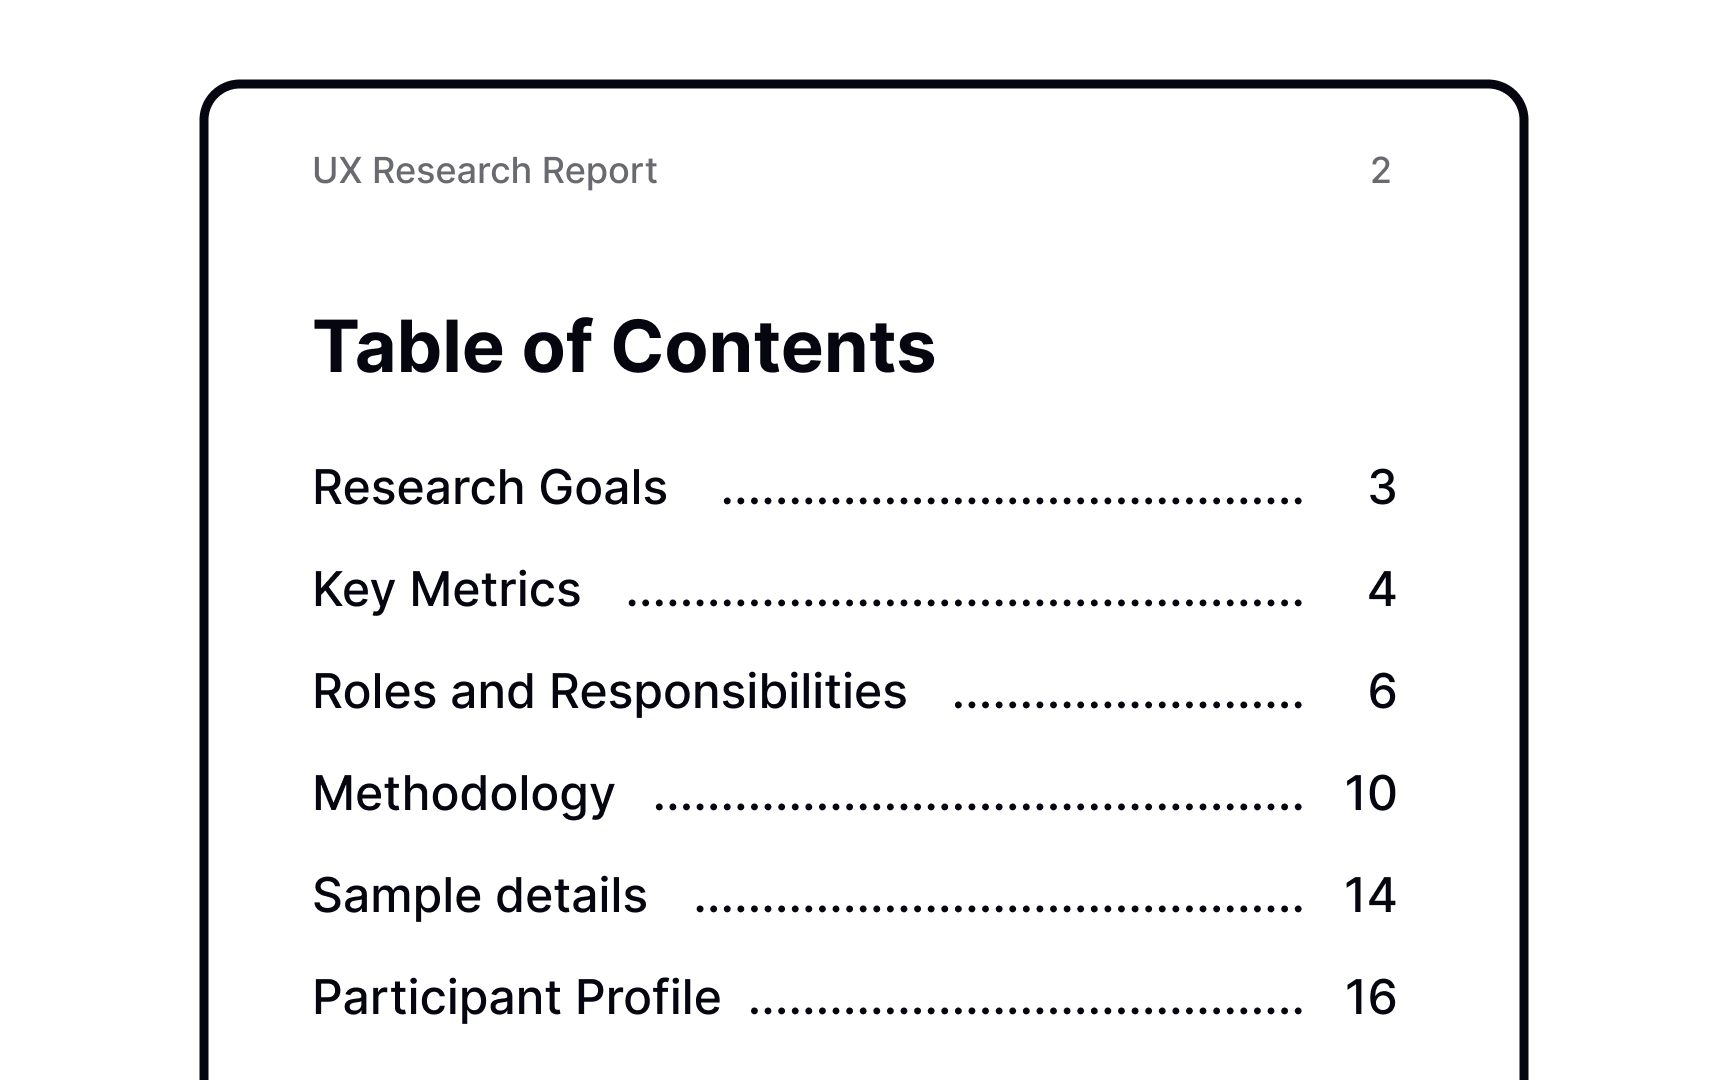
A good report must cover:
- Why your research was commissioned., i.e., your research goals
- The key metrics of your product that led to this decision
- The research methodology used
- The size and nature of the participant sample involved in your study
- Key insights backed by detailed findings
- The recommended future course of action
What were your
Next, it is a good idea to get into the nature of your research study and its participants. This includes your data collection method which could be a survey, user interview, a usability test, or a card sort. Details of your sample size, selection method, and participant profile are also must-haves in the overview.
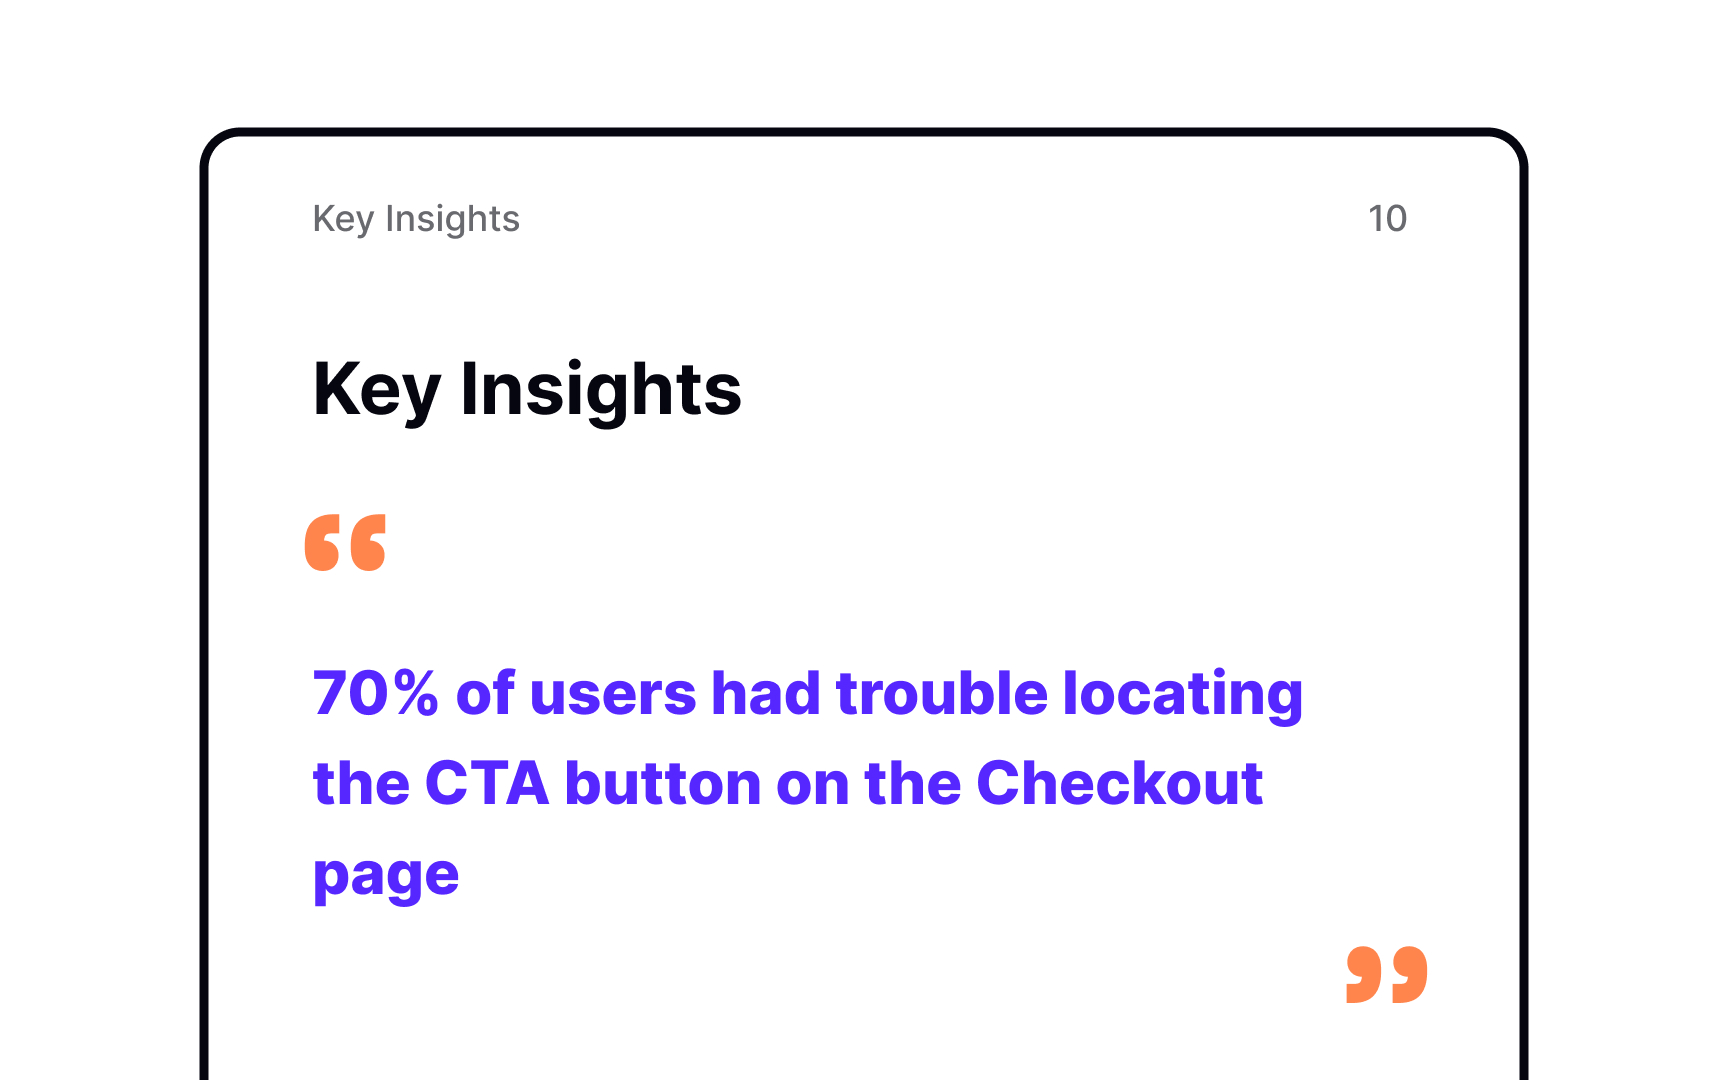
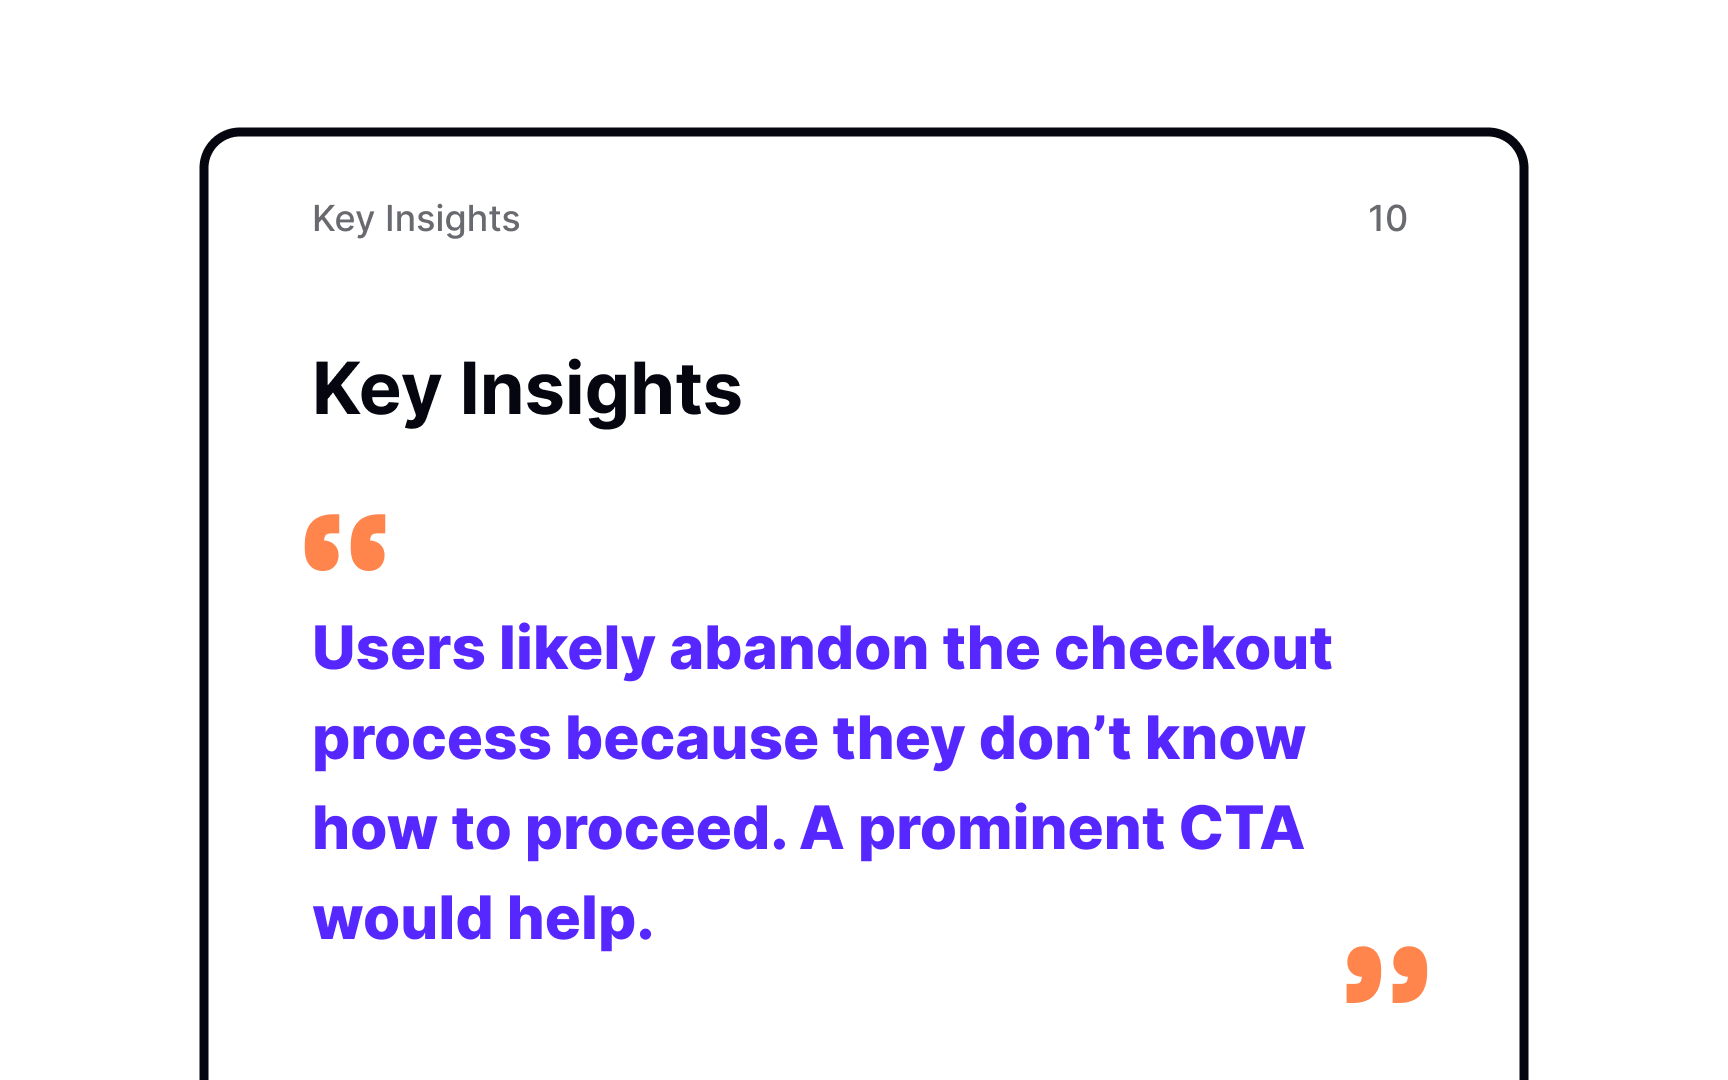
Split the insights section into two parts — key insights and detailed insights. Key insights should cover the most crucial learnings from your study in brief. Keep in mind that an insight is different from a finding. Insights give you a deeper understanding and guide actions — findings are just discovered facts. Insights provide understanding and suggest action, while findings report what’s observed.
The insights section appeals to the stakeholders who do not want to spend hours poring over the minute details and only want to know the end takeaways.
For others, use the detailed insights section. This part will include the data you analyzed to arrive at these insights. Provide a link to your user research repository for those looking for even more details.
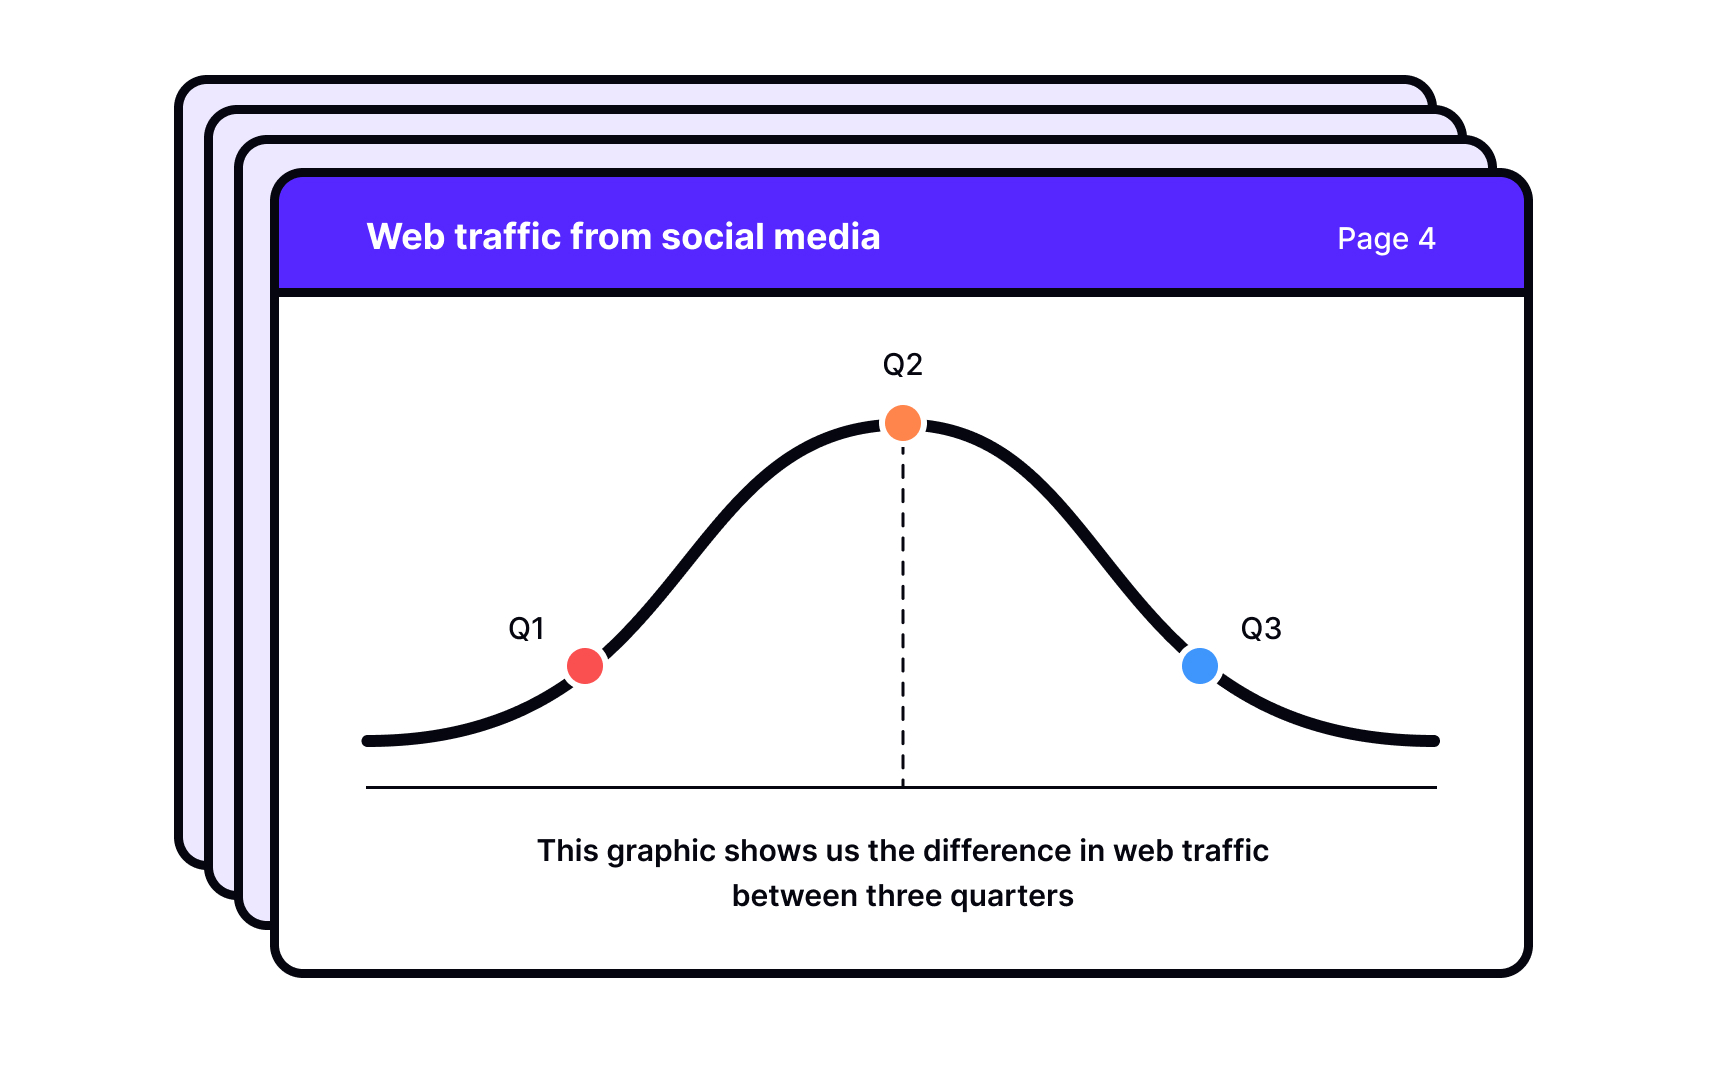
Don’t shy away from the usage of visuals while discussing insights. They help represent data clearly and even make comprehension easy for readers with minimal understanding of the
In the last leg of your
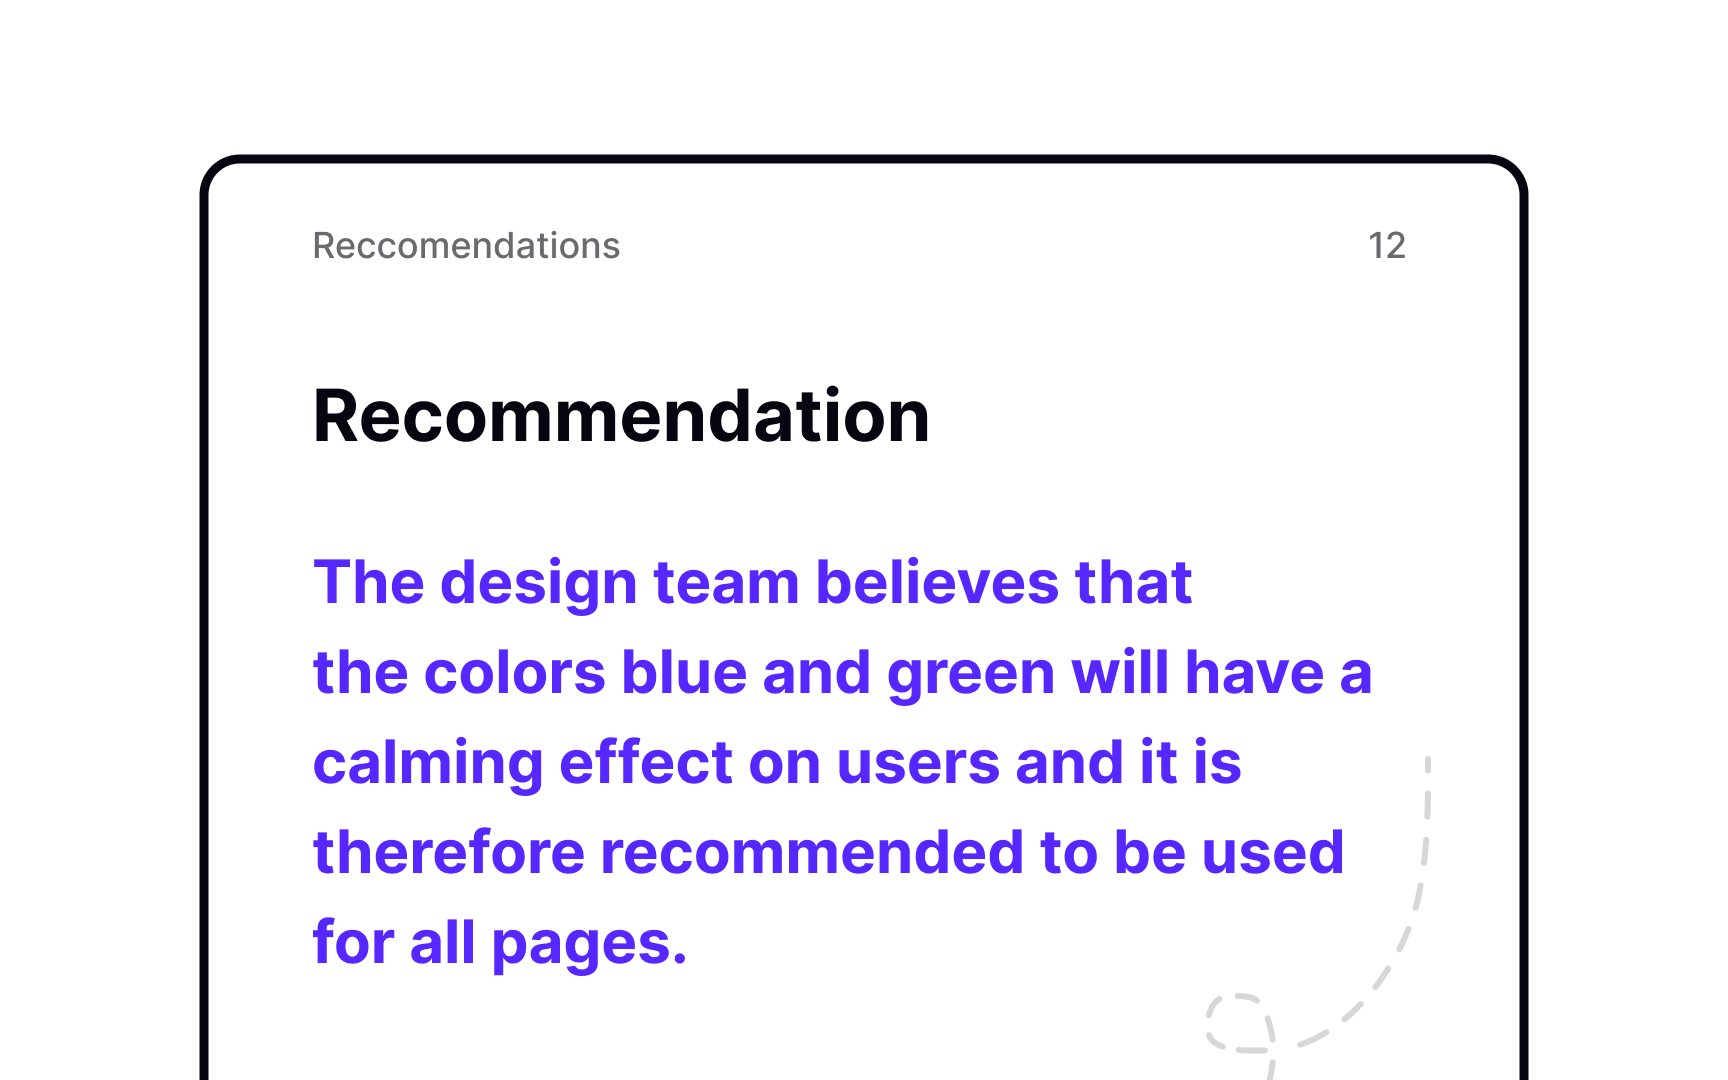
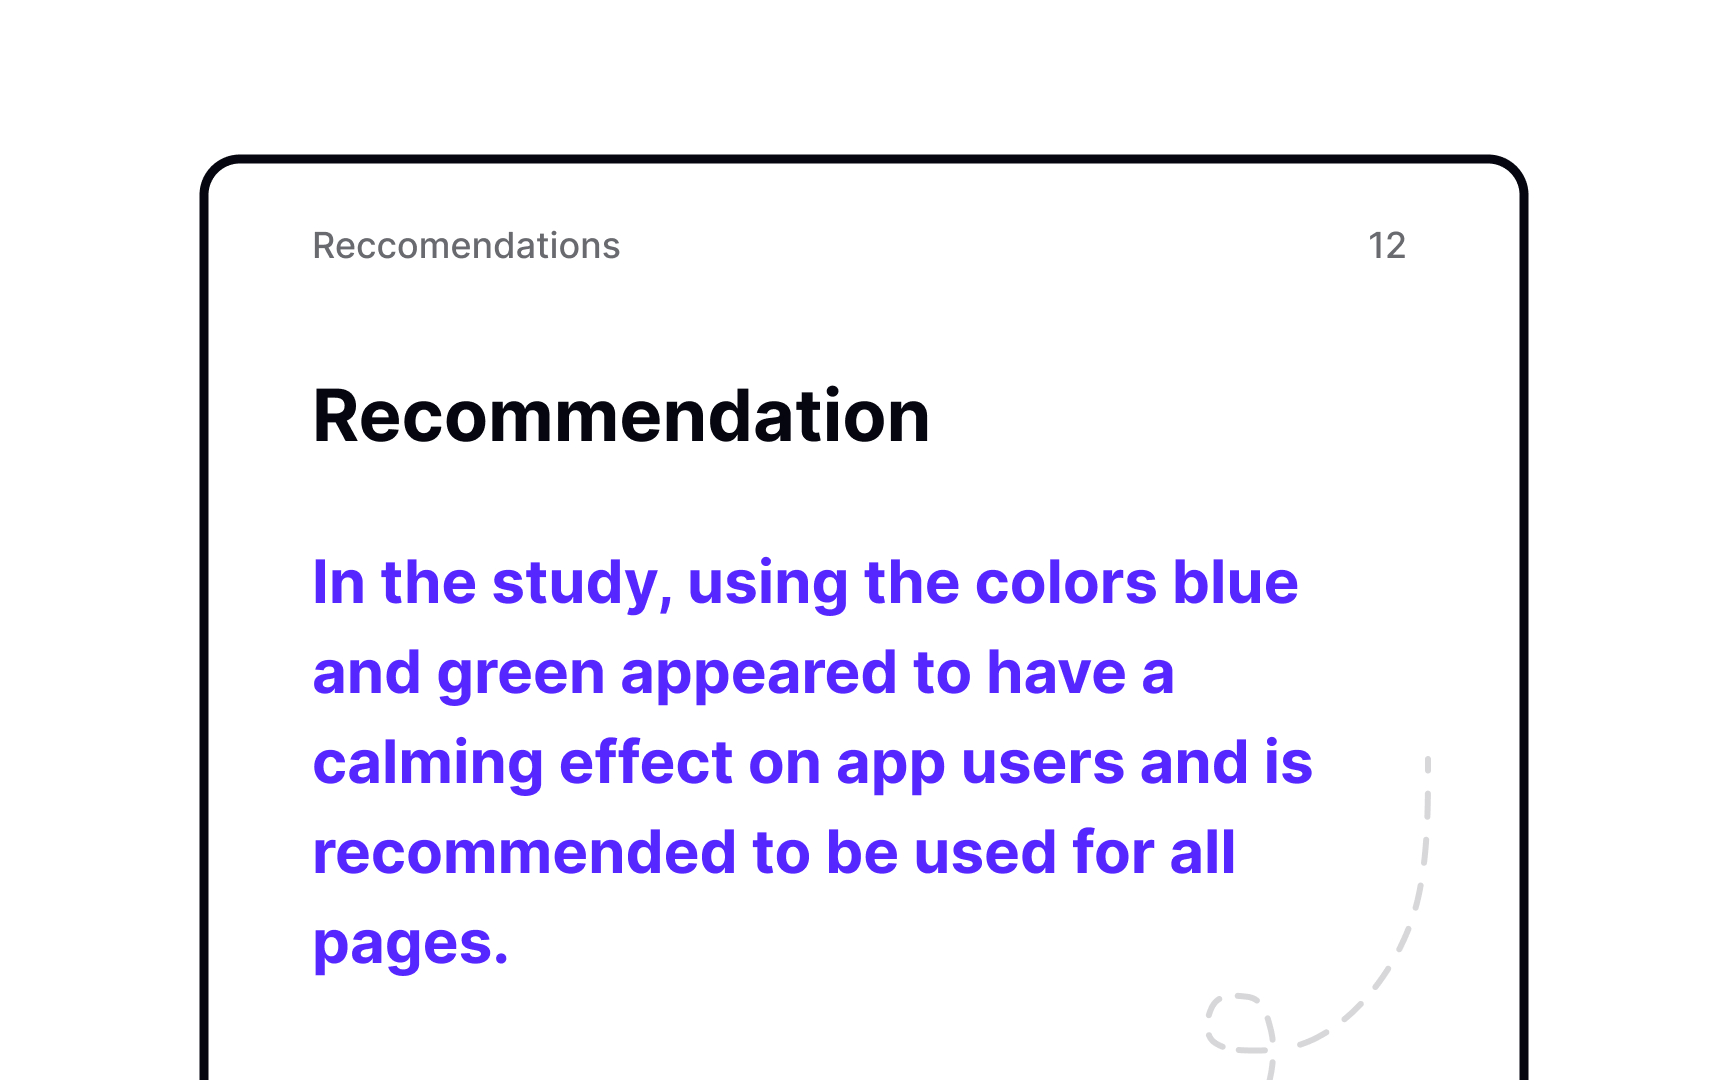
However, abstain from making recommendations that are based on your subjective opinions as it can be antithetical to the purpose of UX research.
When your
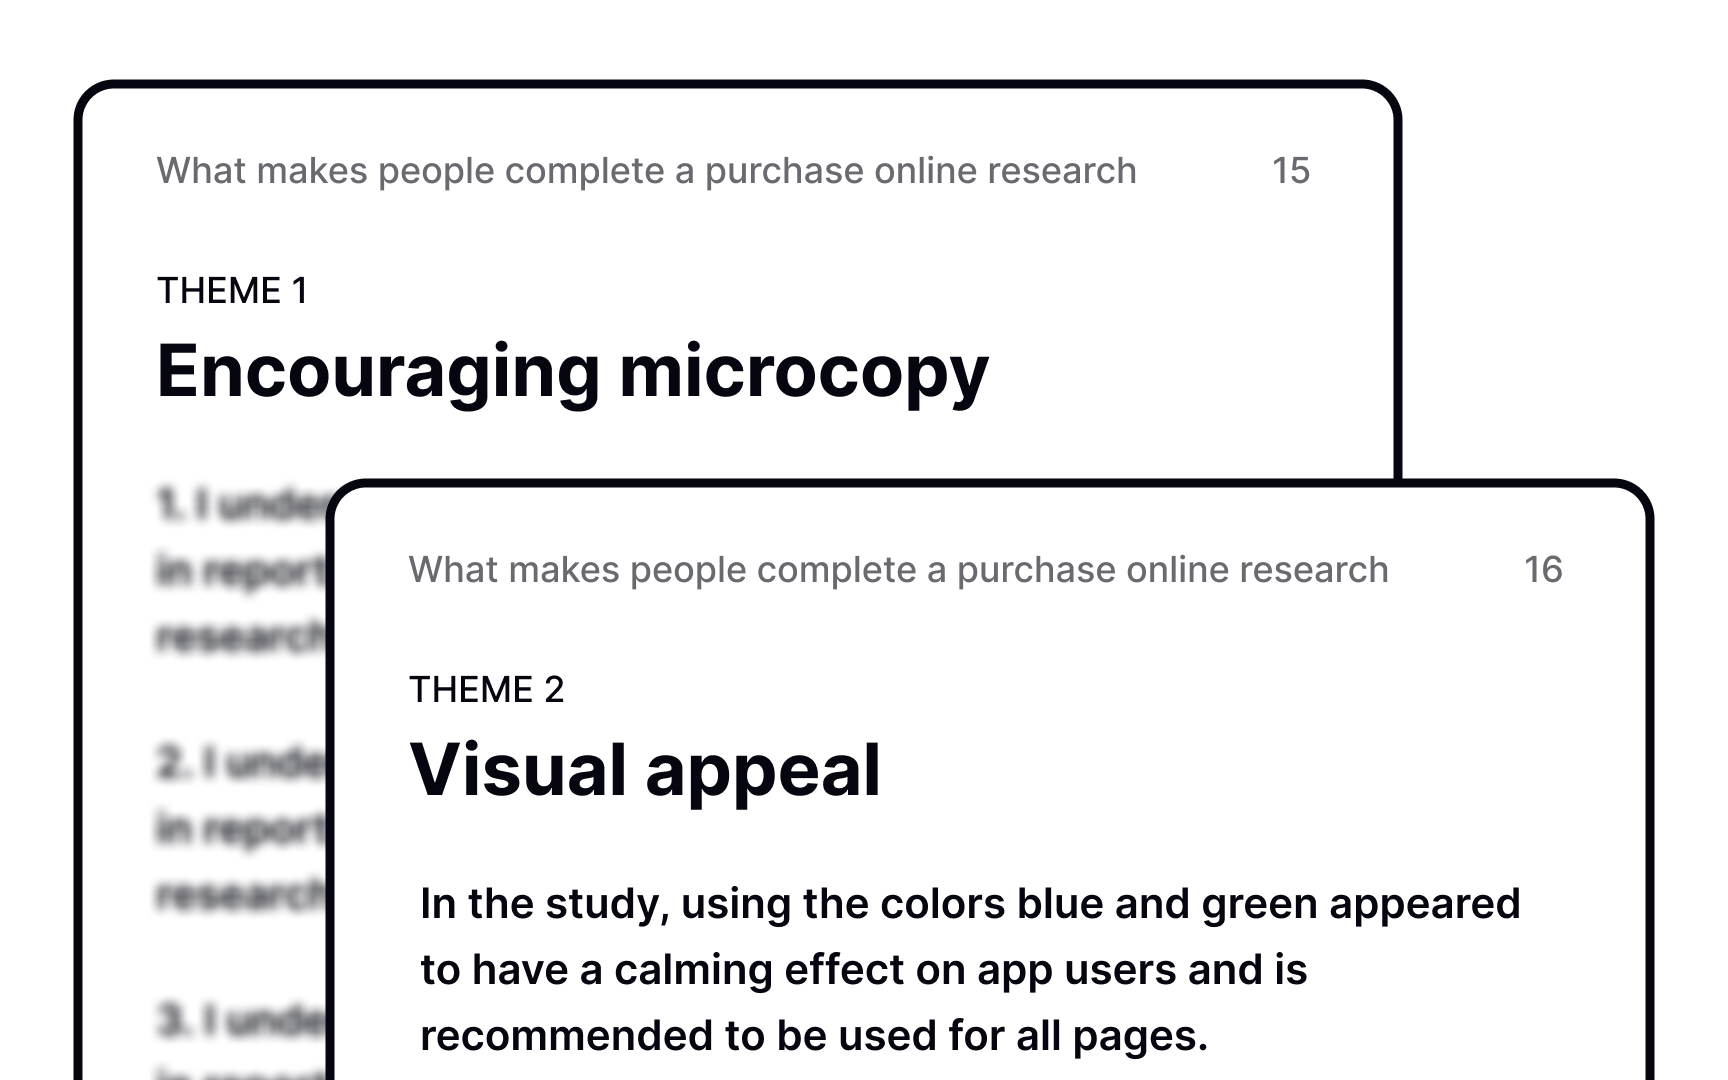
If you carried out an affinity mapping session during the data analysis stage, you’ll already have access to these grouped insights. Present the top 3-5 most common themes that most influenced your research recommendations. This helps provide weightage to the most critical insights of your study. For each theme, provide a theme title, brief overview, and a deeper dive for those interested in the details.[3]
Let's face it — people tend to ignore
Here are some tips to make your research report slideshow a success:
- Choose an interesting presentation theme and give readers a welcome break from monotonous spreadsheets.
- Use memorable visuals, graphics, puns, and slang that will act as a memory trigger for readers.
- Start with an introduction that clearly summarizes what the reader can expect going forward. How long will it take? What will they learn? How will it benefit them?
- Use a legible font, embolden important points, and use catchy headlines.[4]
Apart from the creative freedom to include multimedia, a slideshow's structure should closely mirror the structure of a physical report and include the same sections — an overview, insights, and recommendations.
Remember that your
Outlining your research goals, scope, participants, data collection methods, key insights, and recommendations makes sure that your research is a reliable source of information. It can also function as a good research template that can be used for further studies.
References
Top contributors

Topics
From Course

Share


Similar lessons

UX Research Analysis

Affinity Diagrams in UX Research
