User Funnel Analysis
Learn how to track user journeys to boost conversion rates through strategic funnel analysis
User funnel analysis reveals users' step-by-step journey from their initial interaction to the final conversion. This analytical approach maps out critical touchpoints where users engage, hesitate, or drop off, providing invaluable insights into user behavior patterns. Product teams can leverage funnel analysis to identify friction points, optimize conversion rates, and make data-driven decisions that enhance the overall user experience. Understanding user funnels enables teams to pinpoint exactly where improvements are needed, whether it's streamlining the onboarding process, simplifying checkout flows, or enhancing feature discovery.
By measuring and analyzing conversion rates between stages, teams can quantify the impact of design changes, prioritize improvements, and systematically increase product performance. The strategic application of funnel analysis transforms raw data into actionable insights, helping products evolve based on real user behavior rather than assumptions.
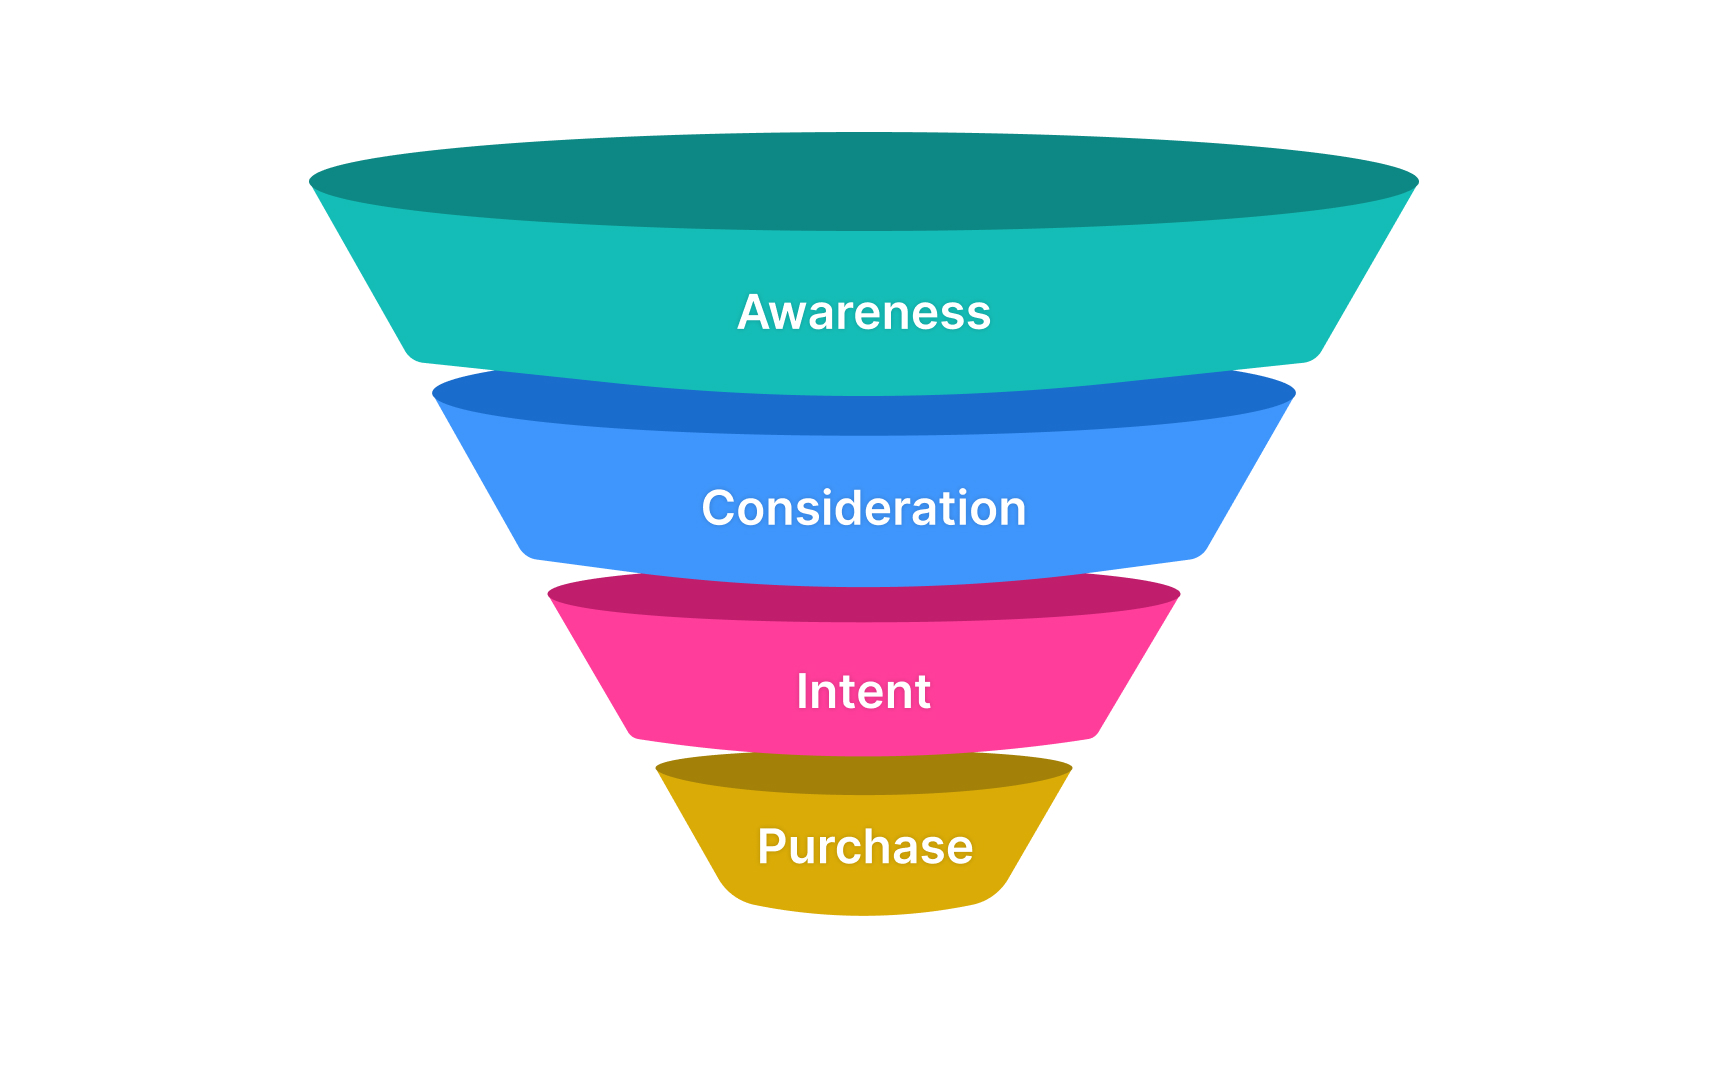
User funnels represent the multi-step journey users take through a product or service, typically visualized as a narrowing path from initial awareness -> consideration → intent → final conversion. In digital products, these funnels track how users progress through key actions like signing up, engaging with features, or completing purchases. Each stage of the funnel shows the percentage of users who continue to the next step, helping teams understand where users drop off.
The concept originates from traditional sales and marketing, where the wide top of the funnel represents all potential customers, while the narrow bottom shows those who complete desired actions. Product teams can use funnel analysis to optimize
Modern product analytics tools automatically capture and visualize these user journeys, enabling teams to measure success at each stage. This data-driven approach reveals exactly where users encounter friction, allowing teams to make targeted improvements rather than relying on guesswork.[1]
Creating effective multi-step funnels requires careful consideration of key user actions that represent meaningful progress toward desired outcomes. Start by identifying the critical events that users must complete in sequence, such as landing page visits, feature
Product
Conversion path analysis examines the various routes users take to complete desired actions, revealing both common and unexpected paths to success.[2] This analytical approach goes beyond traditional funnel analysis by capturing the full complexity of user journeys, including backtracking, skipped steps, and alternate routes. Modern
Understanding path variations helps teams identify optimal routes that lead to higher
Path analysis also reveals opportunities to streamline journeys by removing unnecessary steps or adding shortcuts to frequently accessed features. Teams can use this intelligence to design more intuitive navigation flows and create contextual prompts that guide users along proven successful paths.
Drop-off points are specific stages in a user journey where visitors leave without completing the desired action.[3] These points of abandonment reveal where users face friction, confusion, or lack of motivation to continue. Understanding where users drop off helps prioritize which parts of the product experience need immediate attention.
By comparing drop-off rates across different user segments, devices, and time periods, teams can spot patterns and tackle the most impactful issues first. Common fixes include simplifying complex forms, clarifying unclear instructions, or removing unnecessary steps that may be causing user frustration.
Pro Tip: Monitor drop-off rates after product updates to quickly catch any unintended consequences — sudden changes often indicate problems with new features or designs.
Funnel segmentation splits user journey data into distinct groups based on user characteristics, behaviors, or acquisition channels. This targeted analysis reveals how different user segments move through your product, highlighting varying success rates and pain points. Common segments include new vs. returning users, different device types, or various
Segmentation helps teams uncover hidden patterns that might be missed when looking at aggregate data alone. Each user segment might face unique challenges or show different preferences in their journey. For instance, mobile users might struggle with a particular form that desktop users complete easily, or users from social media might convert better than those from search engines.
Looking at
Pro Tip: Start segmentation analysis with broad categories (like device type or user type) before diving into more specific segments to identify the most impactful differences.
Time to convert measures how long users take to move through each funnel stage and complete desired actions. This metric reveals the typical duration of user journeys and helps identify stages where users get stuck or need more time than expected. Understanding these time patterns helps set realistic expectations and spot opportunities to speed up the conversion process.
Most analytics platforms track both the average and median time between funnel steps. Median times often provide more reliable insights since they're less affected by outliers. For example, in a
Tracking time to convert across different segments and time periods highlights where you can streamline the
Modern user behavior often involves switching between devices during single journey. Someone might discover a product on mobile, research it further on desktop, and finally complete the purchase on their tablet. Cross-platform funnels track user journeys that span multiple devices or platforms, providing a complete view of how users interact with your product across different touchpoints.
Looking at conversion patterns across platforms reveals where users prefer certain devices for specific actions. For example, users might browse products primarily on mobile but switch to desktop for purchases. These insights help optimize each platform's experience for its most common use cases while maintaining consistency across all touchpoints.
Entry point analysis examines how users first discover and enter your product's conversion funnel. Different entry points often lead to varying conversion patterns and success rates. Understanding these patterns helps optimize acquisition channels and create better first-time user experiences for each entry point.
Users might enter through various channels like organic
Compare user behavior patterns across different entry points to identify your most valuable acquisition channels. Look for entry points that bring users who not only convert well but also show strong engagement and retention. This helps focus
Exit point patterns reveal where and why users leave your funnel before completing desired actions. These patterns help identify specific moments of user frustration, confusion, or hesitation that lead to abandonment. Each exit point tells a story about user behavior and potential issues in your product experience.
Analyzing exit patterns goes beyond simple drop-off rates by examining the context of abandonment. Look for signals in user behavior just before exits — like repeated attempts at an action, quick bounces, or unusual
Group exit patterns by user segments and scenarios to uncover deeper insights. Different user types might abandon at different points for different reasons. Common exit triggers include complex forms, unexpected costs, technical errors, or unclear next steps. Understanding these patterns helps prioritize fixes that will have the biggest impact on
References
- Conversion Path Analysis: Why Do You Need It & How to Set It Up | Thoughts about Product Adoption, User Onboarding and Good UX | Userpilot Blog
- User Journey Analytics: The Practical Guide. Use Cases To Drive Growth | Thoughts about Product Adoption, User Onboarding and Good UX | Userpilot Blog
Top contributors

Topics
From Course

Share


Similar lessons

Analytics Strategy & Planning
Data Collection & Tracking
