Revenue & Business Metrics
Explore essential revenue metrics to drive product growth and business success
Revenue metrics reveal the real story of how products make money and grow. From tracking monthly subscriptions to measuring customer value, these numbers guide crucial product decisions. Product teams rely on revenue data to spot winning features, understand user behavior, and find new growth opportunities.
Tracking business metrics helps answer key questions: Which features drive the most value? How long do customers stay? What makes users upgrade their plans? Understanding these metrics transforms gut feelings into confident choices about pricing, features, and growth strategies. With clear revenue insights, teams can focus on what truly matters — building products that users love while growing the business.
A
Monthly recurring revenue (MRR) forms the basic building block of subscription analytics, representing the normalized monthly revenue from all active subscriptions. MRR calculation combines revenue from different subscription tiers and billing periods into a single, comparable monthly value. Annual recurring revenue (ARR) provides a yearly view by multiplying MRR by 12, offering a longer-term perspective on business performance.
Understanding subscriber behavior across different
Pro Tip: Set up automated alerts for significant MRR changes to quickly identify and respond to unusual patterns in subscription behavior.
Customer lifetime value (CLV) measures the total
Basic CLV calculation multiplies the average revenue per customer by the average customer lifespan in months or years. For
Understanding CLV helps prioritize customer segments and guides decisions about marketing spend, feature development, and customer service investments. Different customer segments often show varying lifetime values, making this metric crucial for strategic planning and resource allocation.
Pro Tip: Compare CLV across different customer acquisition channels to identify which sources bring the most valuable long-term customers.
Average
The basic ARPU calculation divides total revenue by the total number of active users in a given period. For example, if a product generates $100,000 in monthly revenue from 2,000 active users, the monthly ARPU is $50. This calculation becomes more complex when accounting for different user types, such as free users versus paying customers.
ARPU variations across user segments, geographic regions, or acquisition channels reveal opportunities for revenue optimization. Higher ARPU usually indicates better monetization, while declining ARPU might signal pricing issues or changes in user mix (for example, more free users than paid users) that require attention.
Monetization metrics measure how effectively a product generates
Product teams can use these metrics to identify revenue bottlenecks and opportunities. For example, a product might track that 5% of free users convert to paid plans, paid users purchase add-ons every 45 days on average, and premium features generate $3.20 per user session. These insights guide pricing strategies, feature development priorities, and
Regular monitoring of monetization metrics helps detect early warning signs of revenue issues and validate business model changes. Segmenting these metrics by user type, acquisition channel, or geographic region provides deeper insights into which aspects of the product drive the most revenue growth.
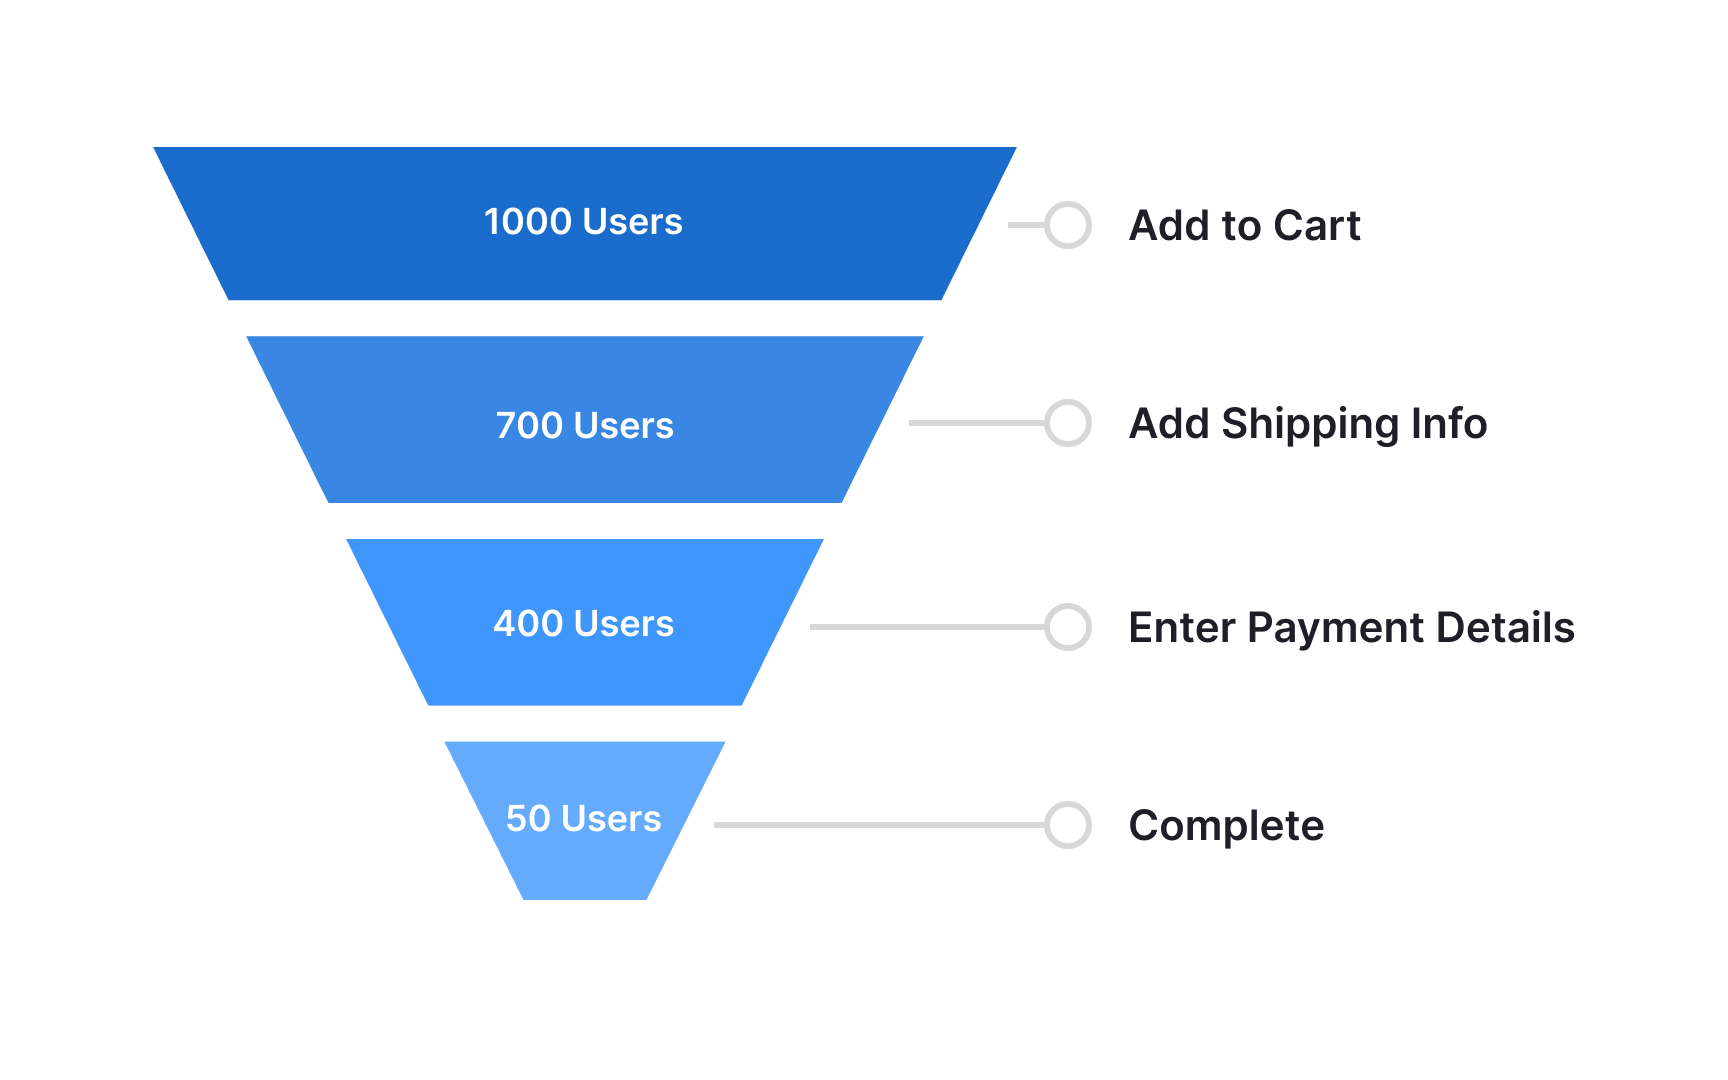
Payment funnel analysis tracks user progression through each step of the purchase process. The funnel typically starts when users initiate a purchase and ends with successful payment completion. Critical tracking points include cart abandonment, payment method selection, form completion, and transaction success rates.
Basic funnel metrics reveal the percentage of users who successfully move through each step. For instance, if 1,000 users start a purchase but only 700 complete payment details and 600 finish the transaction, the funnel shows a 60% completion rate. Common drop-off points often include complex form fields, payment validation steps, or loading delays.
Understanding where and why users abandon the payment process helps optimize
Here's how they work: if you start with 100 customers each paying $1,000 monthly ($100,000 total), and after one year 90 customers remain but some upgraded their plans, you have two numbers to track. GRR looks at just the remaining original payments — so 90 customers at their original
Monthly tracking of these retention metrics helps identify trends in customer satisfaction and product stickiness. High retention rates indicate strong product-market fit and effective customer success programs, while declining retention often signals competitive pressures or product issues requiring attention.
Pro Tip: Track revenue retention separately for different customer segments to identify which types of customers have the highest revenue stability.
Pricing impact analysis evaluates how
A structured price analysis examines both direct and indirect effects of pricing changes. For instance, increasing a product tier's price by 20% might only reduce
Comprehensive pricing analysis requires monitoring multiple metrics simultaneously to understand full business impact. Key indicators include changes in trial-to-paid conversion rates, customer lifetime value, upgrade frequency, and churn rates across different customer segments and time periods.
Pro Tip: Run price sensitivity surveys with a small user segment before implementing major pricing changes to predict potential impact.
Upgrade path analytics examines how users move between different product tiers and
The analysis tracks key timing and conversion metrics between tiers. For example, data might show users typically spend 3 months in the basic tier before upgrading to professional, with a 30%
Tracking upgrade paths helps identify which features drive tier transitions and where users get stuck. This information guides product teams in designing effective upgrade prompts, feature previews, and tier structures that encourage natural progression through pricing tiers.
Understanding segment performance helps prioritize product development and
Billing event tracking monitors all financial transactions and system events related to customer payments. These events include successful charges, failed payments, refunds, plan changes, and billing cycle renewals. Each event provides critical data about the payment ecosystem's health and customer payment patterns.
Payment tracking systems log key information for each event: transaction ID, amount, user details, payment method, and outcome status. For instance, a failed payment event contains the
Monitoring billing events helps identify and resolve payment issues before they affect customer experience or
Basic forecasting uses historical growth rates and seasonality patterns to project future revenue. For example, if a product grows 5% month-over-month and typically sees a 20% holiday season boost, these factors inform the forecast model. More complex models might include factors like planned feature releases,
Accurate forecasting requires regular comparison of predictions against actual results. Teams can track forecast accuracy and refine their models based on learned patterns and prediction
References
- Gross Retention vs Net Retention: What’s the Difference | Thoughts about Product Adoption, User Onboarding and Good UX | Userpilot Blog
Topics
From Course

Share


Similar lessons

Analytics Strategy & Planning
Data Collection & Tracking
