Predictive Analytics
Discover ways to turn historical data into future-focused product decisions
Predictive analytics uses past data and behavior patterns to forecast future product outcomes. Statistical models and machine learning techniques help product teams spot user trends, prevent issues, and make smarter decisions before problems occur. From identifying at-risk users to optimizing feature releases, these tools transform raw data into actionable insights. Product teams can anticipate user needs, personalize experiences, and allocate resources more effectively based on data-backed predictions. By moving beyond simple reporting to future-focused analysis, predictive analytics empowers teams to build products that stay ahead of user expectations and market demands. Rather than reacting to problems, teams can proactively shape product strategy using reliable forecasts and behavioral patterns.
Churn prediction helps identify users likely to stop using your product. Most product analytics tools include built-in features that can detect early warning signs of user dropout. These tools monitor basic engagement patterns and alert teams when users show signs of decreasing activity.
The prediction process relies on common usage metrics that most analytics platforms track automatically. This includes how often users log in, which features they use, and how much time they spend in the product. When these numbers start dropping below normal patterns, analytics tools can flag these users as potential churners.
Teams can typically set up custom alert thresholds in their analytics platform to catch concerning patterns early. This automated monitoring helps teams take action before users actually leave, rather than analyzing churn after it happens. This might include sending helpful tips, offering support, or asking for feedback to understand what's wrong.[1]
Conversion likelihood indicates how likely users are to complete desired actions in your product like subscribing to a service or buying a product. Product
The basic tracking focuses on key activities that typically lead to conversion, like completing onboarding steps, using core features, or engaging with specific product areas. Analytics platforms can automatically track these patterns and calculate conversion probability scores for different user segments.
Teams can then use these built-in prediction features to identify which actions most strongly indicate future conversion. This helps prioritize product improvements and guide users toward successful conversion paths without needing complex analysis.
User behavior forecasting predicts how people will interact with your product in the future. Product
Most analytics platforms include basic forecasting features that look at usage trends over time. They track metrics like daily active users, feature adoption rates, and common user paths through the product. By analyzing these patterns, teams can predict things like peak usage times or which features users might try next.
The forecasting tools work best when tracking concrete actions rather than abstract behaviors. For example, predicting how many users will log in next week is more reliable than predicting user satisfaction. Teams can use these predictions to plan feature releases and allocate resources more effectively.
Seasonal pattern analysis identifies regular cycles in product usage over time. Most analytics platforms can automatically detect these recurring patterns by comparing usage data across similar time periods. Common cycles include daily peak hours, weekday vs. weekend differences, and annual busy seasons.
Understanding seasonal patterns helps teams plan for predictable changes in user behavior.
You can use these insights to optimize product performance during peak times and plan maintenance during natural lulls. Analytics platforms typically include visualization tools that make it easy to spot these patterns and predict when they'll occur again.
Revenue forecasting uses historic data patterns to predict future income from your product. Analytics platforms can detect patterns in user payments, subscription renewals, and upgrade decisions to project future revenue. These predictions help teams make informed decisions about product investments and growth plans.
Most
The forecasting features work best when tracking both leading indicators (user engagement, feature usage) and direct revenue metrics (conversion rates, renewal rates). This combination helps teams identify not just how much revenue to expect, but also which product areas most directly impact revenue growth.
Capacity planning uses analytics to predict how many resources your product will need to run smoothly. Think of it like planning how many seats a restaurant needs — you look at how many customers usually come in, when it's busiest, and how this changes over time. Product
The process starts with measuring basic usage numbers — how many people use your product at once, when usage peaks happen, and how much server power different features need. For example, if your product typically has 1,000 users during the day but 5,000 users every evening, you'll need enough capacity to handle those evening peaks comfortably.
Analytics tools can warn you before you run out of capacity by tracking growth trends. This gives you time to add more resources before users experience slowdowns or crashes. Always add 30% more capacity than your highest regular usage — this buffer helps handle unexpected usage spikes without affecting performance.
Risk prediction helps identify potential problems before they affect your product's performance or user experience. This early detection system works like a weather forecast for your product — spotting storm clouds before they arrive.
The process focuses on tracking stability indicators that
Analytics platforms can learn what "normal" looks like for your product and alert teams when patterns start looking unusual. This helps catch potential issues early, whether they're technical problems, user experience issues, or security concerns. Teams can set custom risk thresholds based on what's normal for their product.
Pro Tip: Set different risk thresholds for different features — critical features need stricter monitoring than experimental ones.
Growth modeling helps predict how your product usage will increase over time.
The basic process tracks growth rates across different metrics that analytics platforms measure automatically. For instance, if new user signups grow by 10% each month and feature adoption typically follows 3 weeks later, teams can predict resource needs and plan feature rollouts accordingly. These patterns help distinguish between natural growth and temporary spikes.
Analytics tools can show which product areas are growing fastest and how different types of growth relate to each other. For example, they might reveal that user growth in one feature leads to increased usage in others, or that certain user segments grow faster than others. This helps teams focus on areas with the strongest growth potential. Focus on the growth of engagement metrics rather than just user numbers — engaged users drive sustainable product growth.
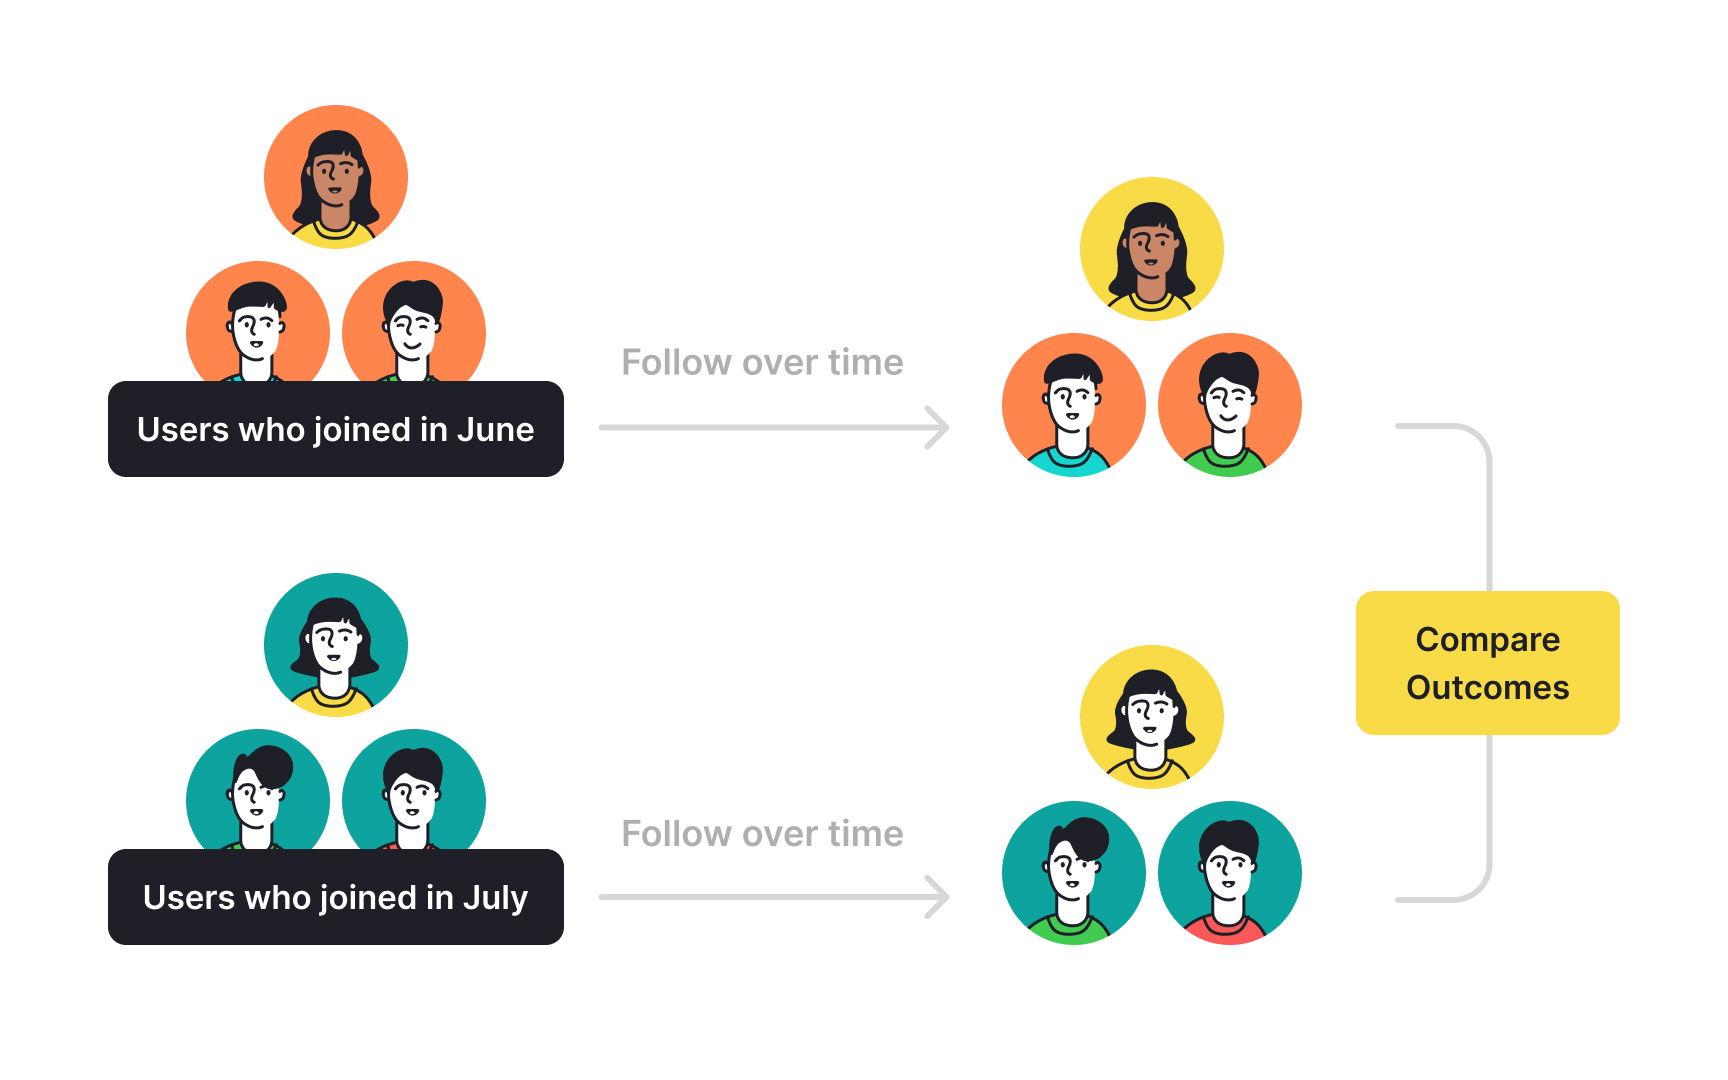
Cohort predictions help understand how different groups of users will behave over time.
Most analytics platforms can automatically create and track cohorts. For example, they might show that users who start with feature A typically try feature B within their first month, while users who start with feature C take a different path. Teams can use these patterns to predict how new users in similar cohorts might behave.
By comparing different cohorts, teams can understand which early behaviors lead to long-term success. Analytics tools can predict things like which users are likely to become power users, or which might need extra help, based on how similar users behaved in the past.


Similar lessons

Analytics Strategy & Planning
Data Collection & Tracking
