Growth Analysis
Learn how to measure and optimize growth engines through advanced analytics and experimental frameworks
Every growth path starts with understanding where users come from — tracking acquisition channels, referrals, and viral spread across networks. Strong products create natural growth loops, where each new user brings in more users, creating a snowball effect. By measuring activation rates and scaling indicators, teams spot exactly where their product gains traction and where it needs improvement.
Market penetration metrics show the bigger picture of product adoption, while growth experiments test new ways to accelerate expansion. Growth forecasting takes this data and turns it into practical predictions, helping teams make smarter decisions about where to focus their efforts. These metrics and measurements work together to form a clear picture of product growth, turning complex data into straightforward insights for better product decisions.
Understanding where your users come from is the first step in product growth. Acquisition channels are the different ways users find and start using your product. These typically include social media, search engines, email campaigns, and direct visits to your website.[1]
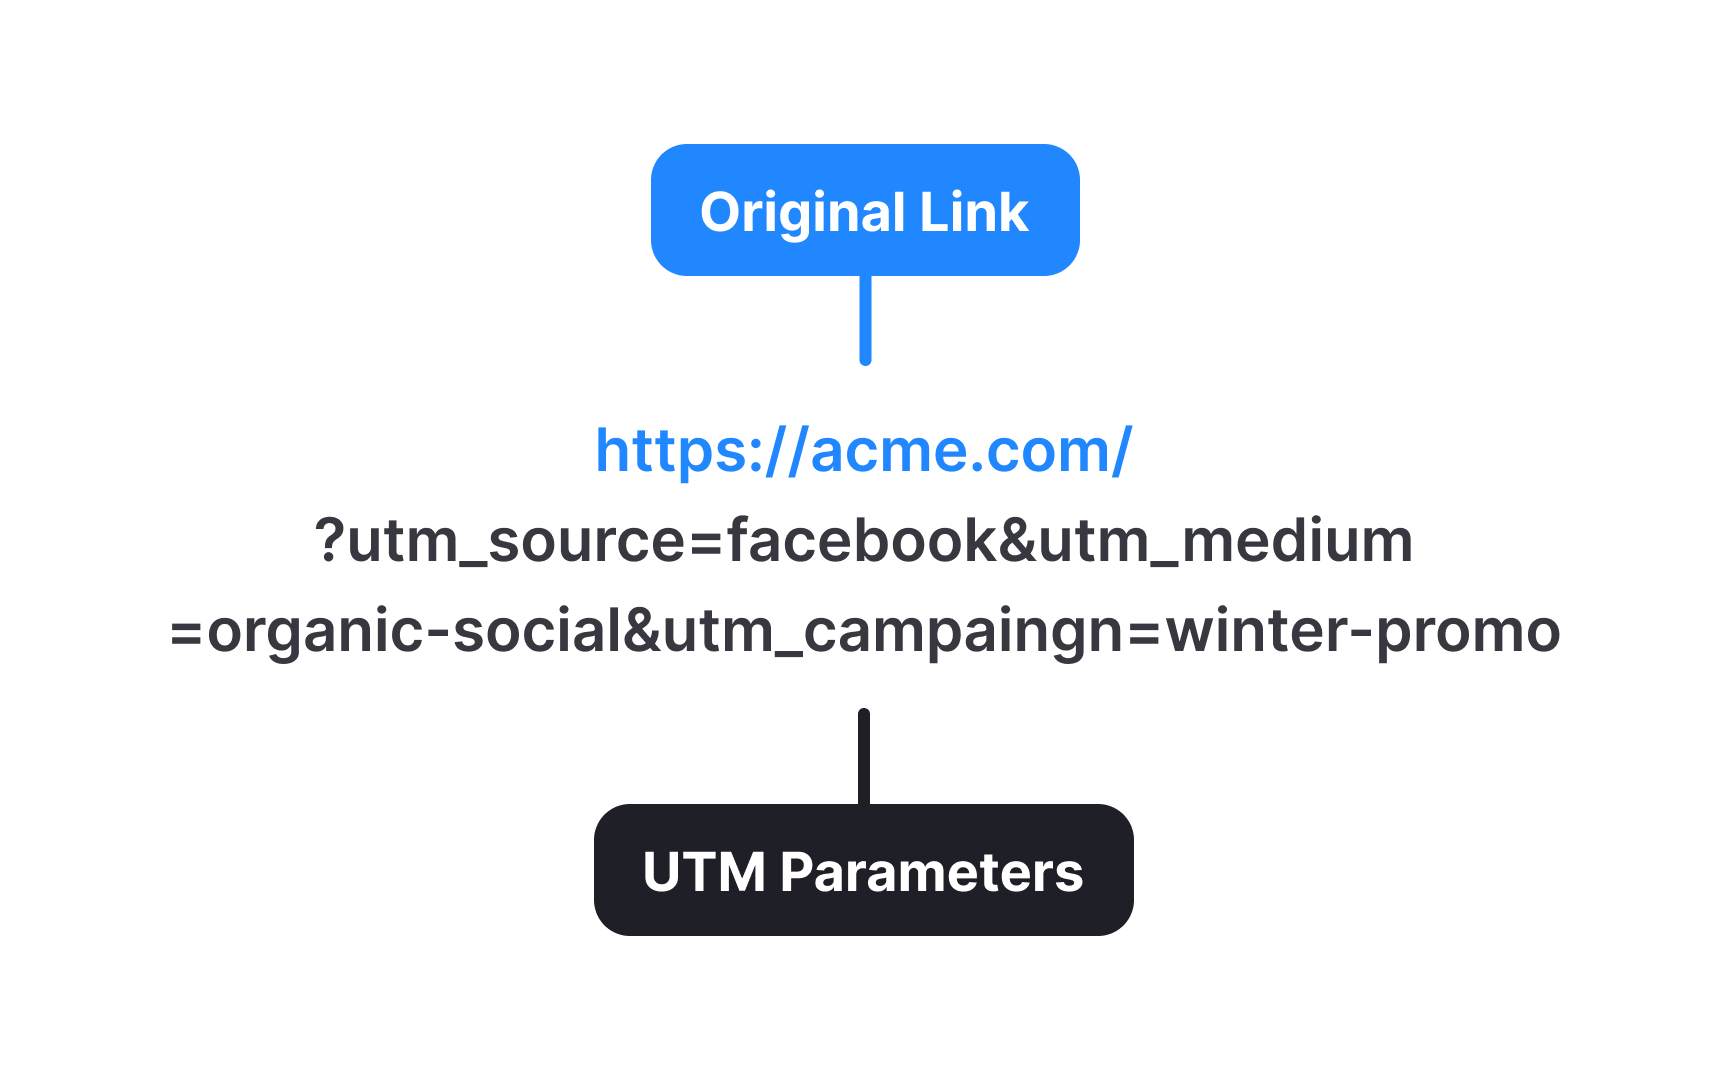
Teams use various methods to track these channels effectively. Analytics tools automatically track basic sources like "direct" visits and search engines. For marketing campaigns, teams add special tracking codes to their links to know exactly where users came from. For example, a link shared on Twitter might include information showing it's from "twitter-december-sale," while an email newsletter link might show "newsletter-welcome-email." App stores provide their own tracking for mobile apps, showing if users found the app through search, categories, or featured listings.
Measuring channel performance involves looking at important numbers for each source: how many visitors come in, how many sign up, and how many become active users. Having clear tracking helps teams understand which channels work best for reaching the right users and growing their product.
Pro Tip: Check your analytics regularly for unexpected traffic sources — they often reveal surprising new opportunities for growth.
Viral coefficient measures how each existing user helps bring in new users to your product. This basic growth metric shows whether your product has the potential to grow on its own through user sharing. A viral coefficient of 1 means each user brings in one new user, while anything above 1 indicates viral growth.
The formula for calculating viral coefficient is simple: multiply the number of invites sent per user by the conversion rate of those invites. For example, if users send an average of 5 invites, and 20% of those invites convert to new users, the viral coefficient is 1 (5 × 0.2 = 1).
Understanding your viral coefficient helps identify opportunities to improve sharing and conversion. Teams can work on making invites easier to send, more appealing to receive, or better targeted to potential users. Regular measurement of this metric shows if sharing features and referral programs are working effectively.
Network effects occur when a product becomes more valuable as more people use it.[2] Classic examples are communication or social media tools, where having more users means more people to connect with. Different types of networks create different growth patterns, affecting how value increases with each new user.
Direct network effects happen when users directly benefit from others joining, like in social networks or messaging apps. Indirect network effects occur when one user group improves the experience for another group — like how more riders make a ride-sharing service more attractive to drivers, and vice versa.
Measuring network effects involves tracking engagement metrics as user numbers grow. Key indicators include interaction rates between users, time spent in the product, and whether users remain active longer when they're connected to more people. Strong network effects show increasing user engagement and retention as networks grow.
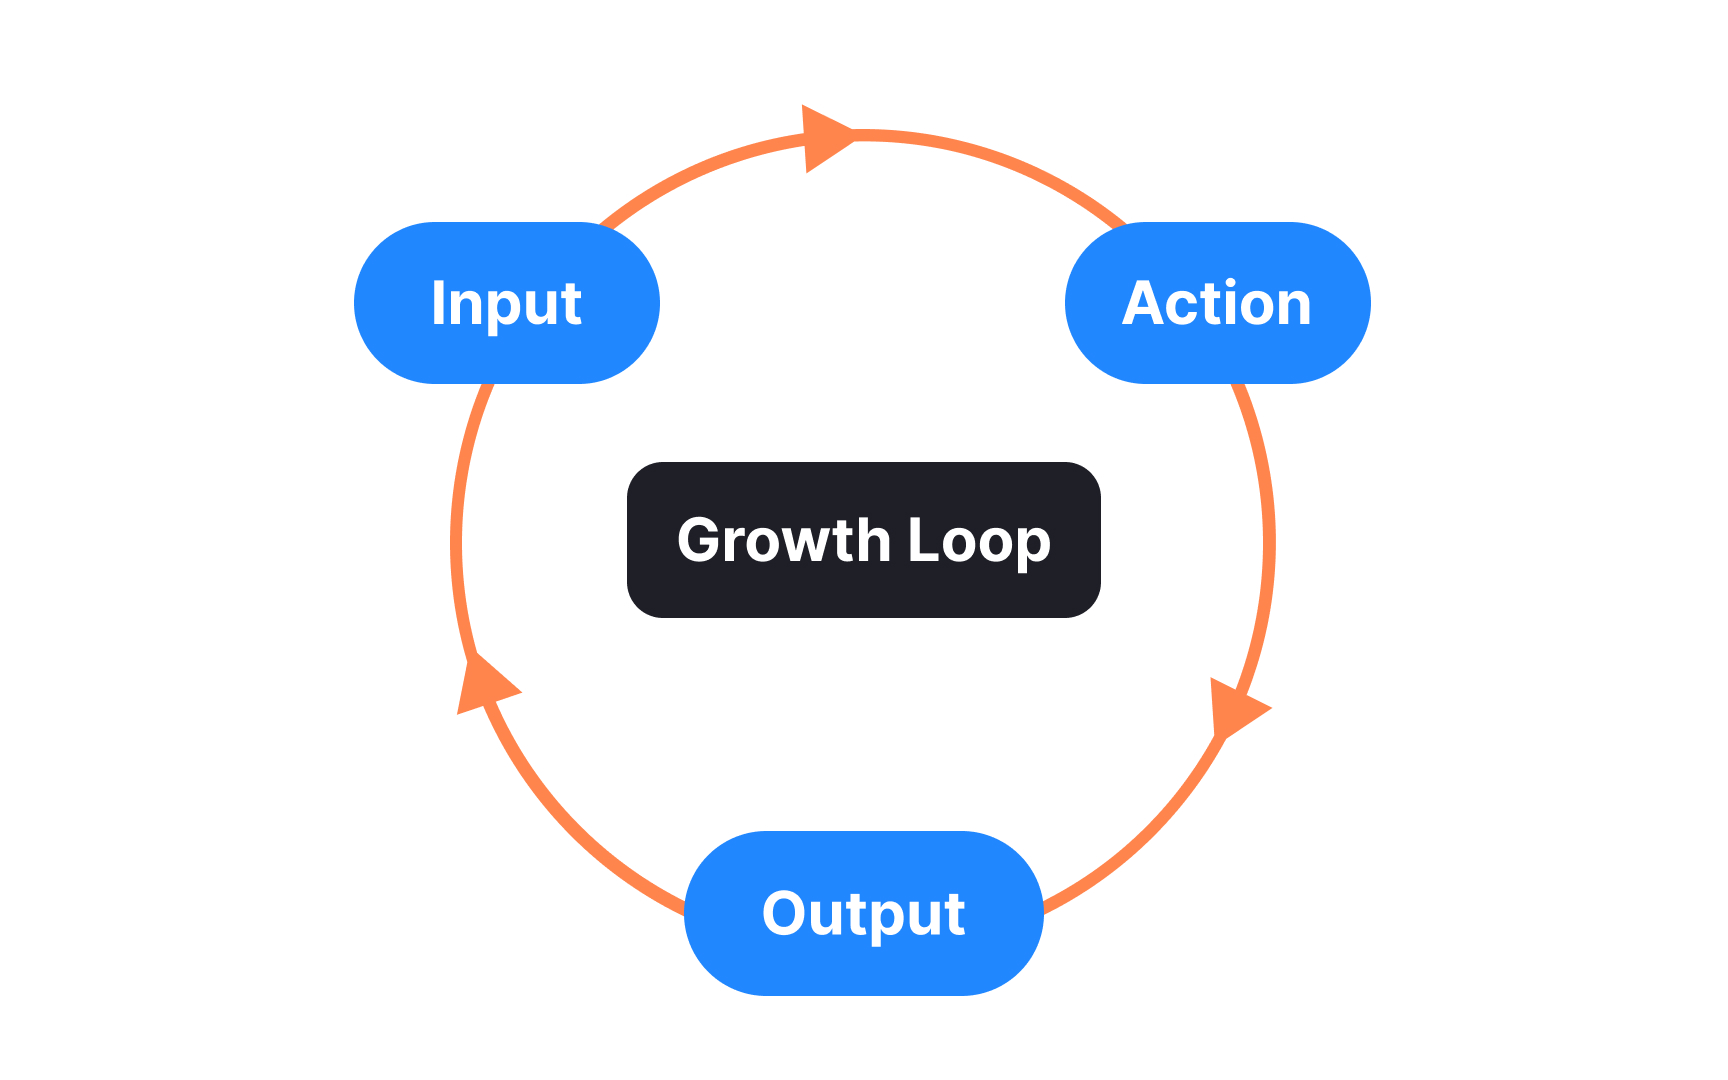
Growth loops show how users naturally create more growth while using your product. Unlike traditional funnels that have a clear end, loops keep cycling to generate continuous growth. Each cycle should make the next cycle stronger, creating compound growth over time.
A basic growth loop starts when current users take actions that bring in new users. For example, users creating and sharing content brings in new viewers, who then become content creators themselves. The more content created, the more new users discover the product through
Teams can map their growth loops by tracking the steps users take that lead to new user acquisition. Common patterns include content loops (create-share-discover), viral loops (invite-join-invite), and marketplace loops (supply-demand-supply). Finding the strongest loops helps teams focus on the actions that drive sustainable growth.

Referral programs turn satisfied users into product advocates by encouraging them to recommend your product to others. Tracking these referrals shows which users bring in new users, what motivates successful referrals, and how referred users behave differently from other users.
Good referral tracking captures the full referral journey. It starts with identifying who made the referral, how they shared it (
Referred users often show different patterns than users from other channels. They typically trust the product more quickly and stay active longer because they came through a trusted source. Tracking these differences helps teams understand the true value of referral programs and how to improve them.
Scaling indicators help teams spot when their product is ready to grow bigger and what might get in the way. These metrics show if your product can handle more users while keeping quality and performance strong. Think of them as your product's vital signs during growth.
Key scaling indicators include server response times, customer support ticket ratios, and user satisfaction scores as user numbers grow. They also track if costs per user grow faster or slower than revenue per user. Good scaling means being able to serve more users while keeping these metrics stable.
Cost per user, team workload, and system performance create your scaling limits. For example, if support tickets grow faster than new users, you might need better self-service tools before scaling further. Understanding these indicators helps teams grow sustainably without breaking what already works well.
Pro Tip: Monitor your product's performance with both small and large user groups — scaling issues often only appear when usage suddenly increases.
Growth experiments test new ideas to improve product growth in a structured way. For example, if users aren't inviting friends, you might test adding a "Share with Friends" button right after they complete a task. Each experiment focuses on one change to clearly measure if it works.
A good experiment starts with 3 parts: what you think will happen, how you'll measure success, and how you'll test it. For the share button example, your hypothesis might be "Adding a share button after task completion will increase referrals by 20%." You'd measure success by tracking how many users click the button and send invites.
Running the test means showing the new share button to half your users (Group A) while others don't see it (Group B). After a week or two, you compare the groups. If Group A sent 25% more invites than Group B, your hypothesis was right. If there's no difference, you might need to explore other changes.
Market penetration shows what percentage of your potential market currently uses your product. This metric helps teams understand their growth potential and market position. For example, if 5,000 companies in your target market use project management tools, and your product has 500 users, your market penetration is 10%.
Calculating market penetration starts with defining your total addressable market (TAM). Define your market specifically — "all businesses" is too broad, but "independent coffee shops in urban areas" gives clearer growth targets. Then compare your current user base to this total to find your penetration rate. Breaking this down by segments like geography or user type shows where you're strong and where you can grow.
Teams can use market penetration data to spot growth opportunities. Low penetration in certain segments might mean untapped potential, while high penetration suggests looking for new markets.


Similar lessons

Analytics Strategy & Planning
Data Collection & Tracking
