Data Quality & Governance
Learn the essentials of maintaining high-quality data and implementing effective governance strategies for reliable product insights
Data quality and governance determine the accuracy and trustworthiness of every insight derived from data. Poor data quality costs organizations an average of $12.9 million annually, highlighting the need for robust data governance frameworks[1]. Data quality encompasses the accuracy, completeness, consistency, and timeliness of data points collected throughout the product lifecycle.
Well-implemented governance policies establish clear ownership, standardized collection methods, validation protocols, and compliance measures that safeguard data integrity. Organizations that prioritize these foundational elements gain confidence in their analytical decisions, reduce technical debt, and maintain stakeholder trust. All in all, systematic approaches to quality and governance transform raw data into a strategic resource that drives product success and innovation.
Quality assurance in data collection means checking if your data is accurate and complete before using it for analysis. Common data issues include duplicate user IDs, impossible values (like negative prices), or missing required fields that could lead to wrong conclusions about user behavior.
Teams use data validation tools like Great Expectations or simple SQL queries in their data warehouses to automatically check their data. For example, these tools can flag if a user's age is logged as 200 years, if purchase amounts are recorded as $0, or if event timestamps are set in the future. Analytics platforms like Amplitude and Mixpanel also provide built-in data quality alerts.
Regular monitoring involves both automated and manual checks. For instance, you might set up alerts for when your daily active user count suddenly drops by 30%, when your event tracking shows duplicate purchases, or when user attributes like “country” contain invalid values. These issues should be documented and fixed quickly to maintain reliable analytics.
Data privacy laws differ across countries and regions, affecting how you collect and handle user data. GDPR in Europe requires explicit user consent and gives users the right to access or delete their data.[2] CCPA in California focuses on giving users control over data sales[3], while LGPD in Brazil combines aspects of both.[4]
Each regulation has specific requirements for data handling. For instance, GDPR mandates that you document the purpose of data collection, limit data retention periods, and report breaches within 72 hours. Different regions also have varying rules about data localization — some require user data to be stored on servers within their borders.
Compliance for such laws isn't optional — fines can be substantial. In fact, GDPR violations can cost up to €20 million or 4% of the company's global revenue.[5] Beyond fines, compliance builds user trust and protects your business. For compliance, start by mapping what data you collect and where it’s stored. Next, document all processing activities, and implement necessary security measures like data encryption and access controls.
Data
Common retention rules might be: keeping account information while users are active, storing payment records for several years (usually required by law), and keeping usage data for a few months upto a year. Each type of data needs its own expiration date based on how long it's actually useful and what laws require.
The key is having clear rules about what to keep and what to delete. For example, Google Analytics automatically deletes old user data after 14-50 months, depending on your settings. Set similar rules for your product's data — keep what you need, delete what you don't, and be clear about these timeframes in your privacy policy.
User consent management is about asking permission before collecting data and respecting users' choices. This means showing users clear options about what data you want to collect and why you need it. For example, you might ask if it's okay to track which features they use or remember their preferences.
Popular websites handle this with cookie banners that let users say yes or no to different types of tracking. When a user says no to analytics tracking, your tools must stop collecting their data. If they say yes to functional cookies but no to marketing ones, you need to follow these choices exactly.
The key is making it simple for users to both understand and control their choices. Provide clear language like "We want to understand how you use our product to make it better" instead of technical terms. Also make sure users can easily change their mind later through your app's privacy
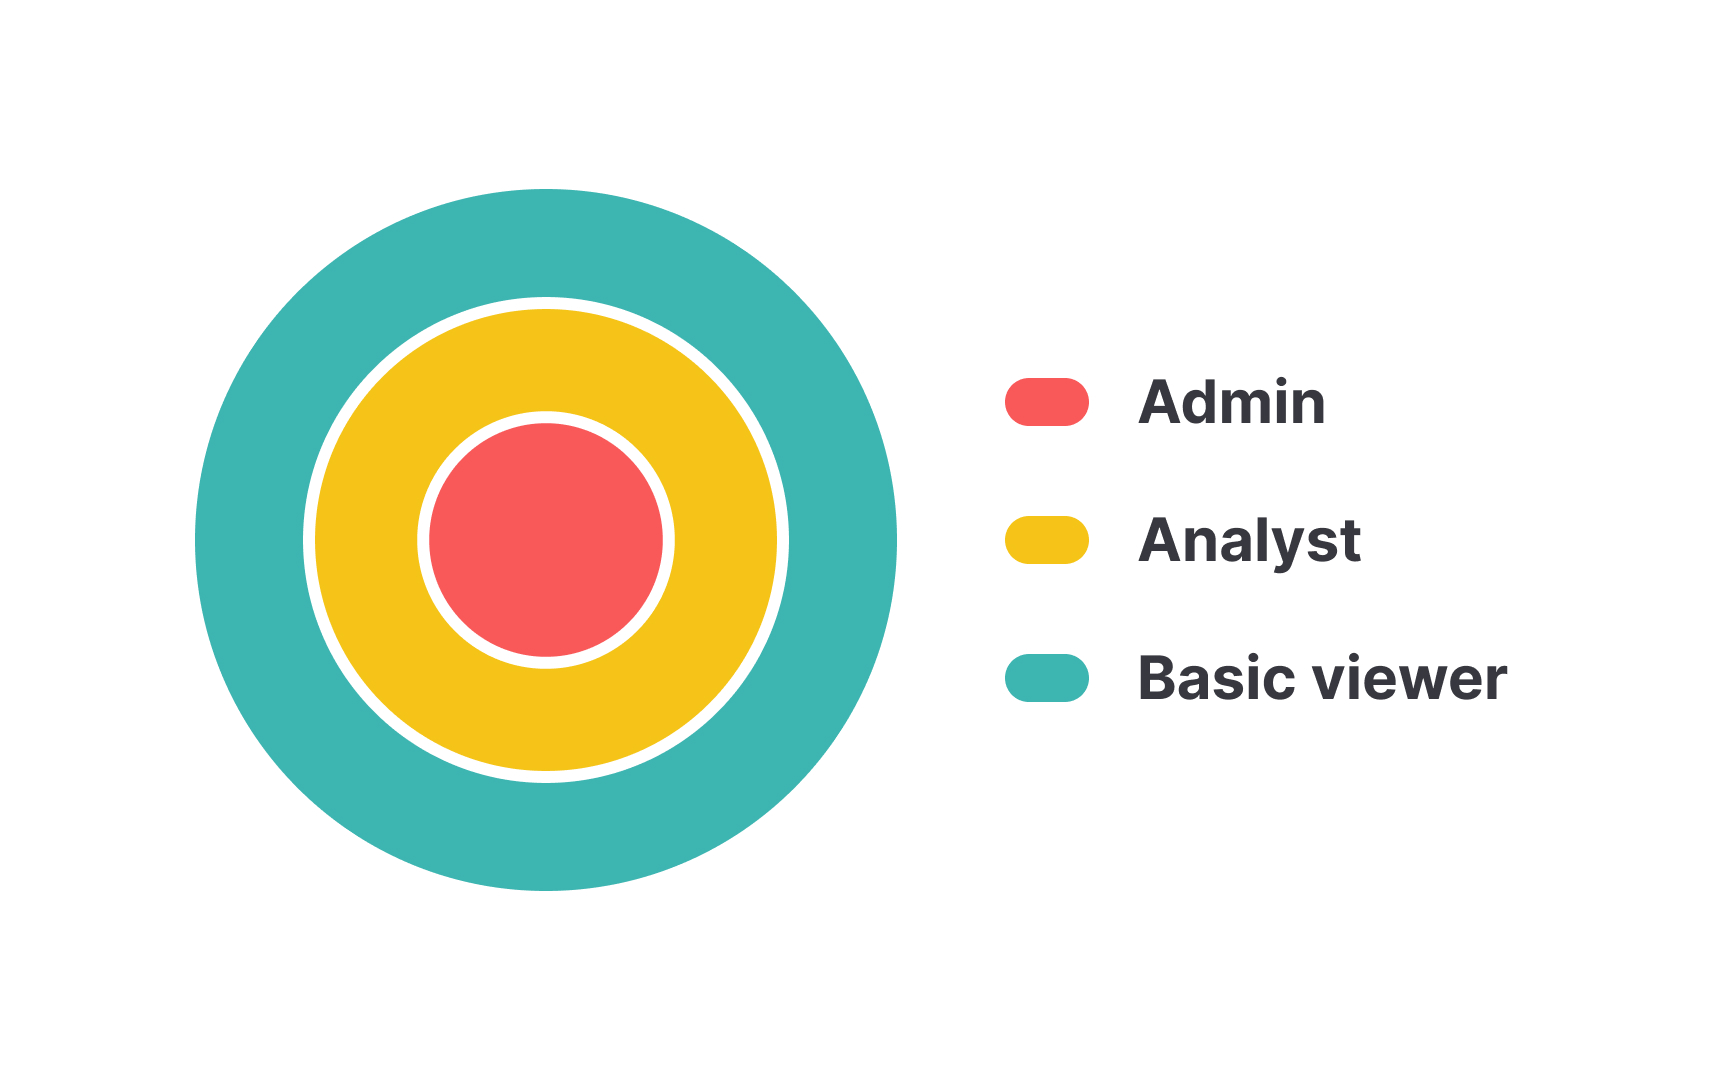
Access controls determine who can view and use different types of data in your product. Just like how a bank only lets specific employees access customer financial information, your data needs similar protections. Think of it as having different keys for different doors.
Basic access control includes roles like admin, analyst, and viewer. For example, analysts might see anonymous user behavior data but not personal information, while customer support might see user profiles but not aggregate analytics. Tools like Snowflake and Google Analytics let you set these
Setting up proper controls prevents data misuse and accidents. Use the "least privilege" approach — give people access only to the data they need for their job. For instance, new team members might start with read-only access to basic dashboards before getting more permissions as needed.
A data taxonomy is like a dictionary for your product data — it defines what each piece of data means and how it should be named. Just like how a library organizes books by categories, your data needs a clear organization system that everyone understands.
Good names help everyone understand what the data means without having to ask around. For example, instead of "btn_clk", use "signup_button_clicked" — it's immediately clear what this event tracks. Follow a consistent pattern for all events.
Here are some best practices:
- Use the format "object_action" like "message_sent" or "
profile _updated." For more detailed events, add relevant details at the end: "video_played_duration" or "article_shared_platform." - Keep names in lowercase, use underscores between words, and avoid spaces or special characters.
- Common events should be named similarly across features. If you track button clicks, always use "_clicked" (not sometimes "_pressed" or "_tapped"). Use "started," "completed," "failed," or "updated" consistently for process stages. This makes it easier to find and compare related events across your product.
- Document these naming rules in a shared place like Notion or Confluence so all team members use the same terms when working with data.
Error tracking helps you find and fix problems in your analytics implementation. When data collection breaks, error tracking tells you exactly what went wrong and where. This is different from data validation — it focuses on technical failures like tracking code errors, API timeouts, or integration problems.
Common error tracking includes failed API calls, JavaScript errors, and data pipeline failures. Tools like Sentry and Datadog can catch these issues automatically. For example, they'll alert you if your analytics tags stop firing, if there are JavaScript errors in your tracking code, or if your data warehouse ingestion fails.
Set up alerts for different error types based on their severity. Critical errors (like complete tracking failure) need immediate attention, while minor issues (like occasional timeouts) can be reviewed daily. Group similar errors together to spot patterns — like tracking breaks after specific types of code deployments.
Documentation helps everyone understand how your analytics is set up and how to use it correctly. Good documentation is like a manual for your data — it explains what you track, why you track it, and how to use the information. Keep it simple and up-to-date.
So, basic documentation should essentially cover these 3 things:
- A list of all events and their meanings
- A guide to your naming patterns
- Instructions for common tasks
For example, document that "user_
Store documentation where everyone can find it easily, like Notion, Confluence, or a shared Google Doc. Include practical examples — if you track "purchase_completed," show a real event with its attributes. Update docs whenever you add new tracking or change existing events to avoid confusion.
References
- 12 Actions to Improve Your Data Quality | Gartner
- California Consumer Privacy Act (CCPA) | State of California - Department of Justice - Office of the Attorney General
- Fines / Penalties - General Data Protection Regulation (GDPR) | General Data Protection Regulation (GDPR)
Topics
From Course

Share


Similar lessons

Analytics Strategy & Planning
Data Collection & Tracking
