Customer Satisfaction Measurement
Explore the key metrics and methodologies needed to measure and analyze customer satisfaction effectively
Customer satisfaction measurement transforms abstract user sentiments into concrete, actionable data points that drive product success. From the game-changing Net Promoter Score (NPS) that predicts business growth to real-time satisfaction pulses through Customer Effort Score (CES), modern measurement tools create a dynamic feedback loop between users and product teams. What makes satisfaction metrics truly powerful is their ability to uncover hidden patterns — revealing exactly why customers love certain features or struggle with others.
Smart product teams leverage these insights to spot emerging trends, catch potential issues before they escalate, and double down on what customers value most. Through a mix of quantitative scores and qualitative feedback, satisfaction measurement becomes more than just tracking numbers — it becomes a strategic compass for product decisions. By mastering these measurement frameworks, product teams gain the superpower to understand customer sentiment at scale, predict future behaviors, and systematically strengthen the bond between product and user.
The final NPS calculation subtracts the percentage of Detractors from the percentage of Promoters, resulting in a score ranging from -100 to +100. Regular NPS tracking helps identify trends in customer sentiment and predict business growth potential.
A negative NPS indicates significant customer experience issues that need immediate attention. Scores between 0 and 30 suggest you're on the right track but have room for optimization. When your NPS exceeds 30, it signals strong customer satisfaction and a healthy business relationship with users. The coveted 70+ range represents exceptional customer loyalty — these promoters actively champion your product and drive organic growth through enthusiastic referrals.[2]
Pro Tip: Schedule NPS surveys after key customer interactions or milestones rather than at fixed intervals to gather more contextual feedback.
Customer Satisfaction Score (CSAT) provides immediate feedback on specific interactions or product experiences. The metric typically uses a 1-5 scale, asking customers to rate their satisfaction with a particular experience, feature, or interaction. This granular approach allows teams to pinpoint satisfaction levels for different aspects of their product.
CSAT calculations convert responses into percentages, focusing on the proportion of satisfied customers (those who select 4 or 5 on the scale). This straightforward calculation makes CSAT particularly effective for tracking satisfaction trends over time and comparing performance across different product areas or service touchpoints.
High-performing organizations often maintain CSAT scores of 70-80% or above, though this varies by industry and context.[3] CSAT proves most valuable when measuring satisfaction with specific features or recent changes, making it an essential tool for product iteration and improvement cycles.
Pro Tip: Use CSAT surveys immediately after specific interactions while the experience is fresh in customers' minds for more accurate feedback.

Customer Effort Score (CES) measures the ease of customer
CES surveys typically appear after specific interactions like completing a purchase, using a feature, or resolving a support ticket. The timing makes CES particularly valuable for identifying friction points in user journeys and workflows. Modern CES implementations often include follow-up questions to understand the reasons behind high-effort scores.
Analysis of CES data reveals that customers who report low effort are more likely to make future purchases and more likely to increase their spending. Companies with low CES typically see lower support costs, higher first-contact resolution rates, and increased customer retention.
Support ticket analytics transforms raw customer service data into actionable insights about product satisfaction and user pain points.
The system tracks essential metrics including:
- Ticket volume trends (showing overall demand for support)
- Resolution time (measuring efficiency in fixing issues)
- First response time (indicating initial service speed),
- Recurring issue patterns (highlighting systematic problems)
These metrics combine to create a comprehensive view of both customer satisfaction levels and underlying product health. Most modern analytics platforms integrate deeply with product usage data, providing rich context around support
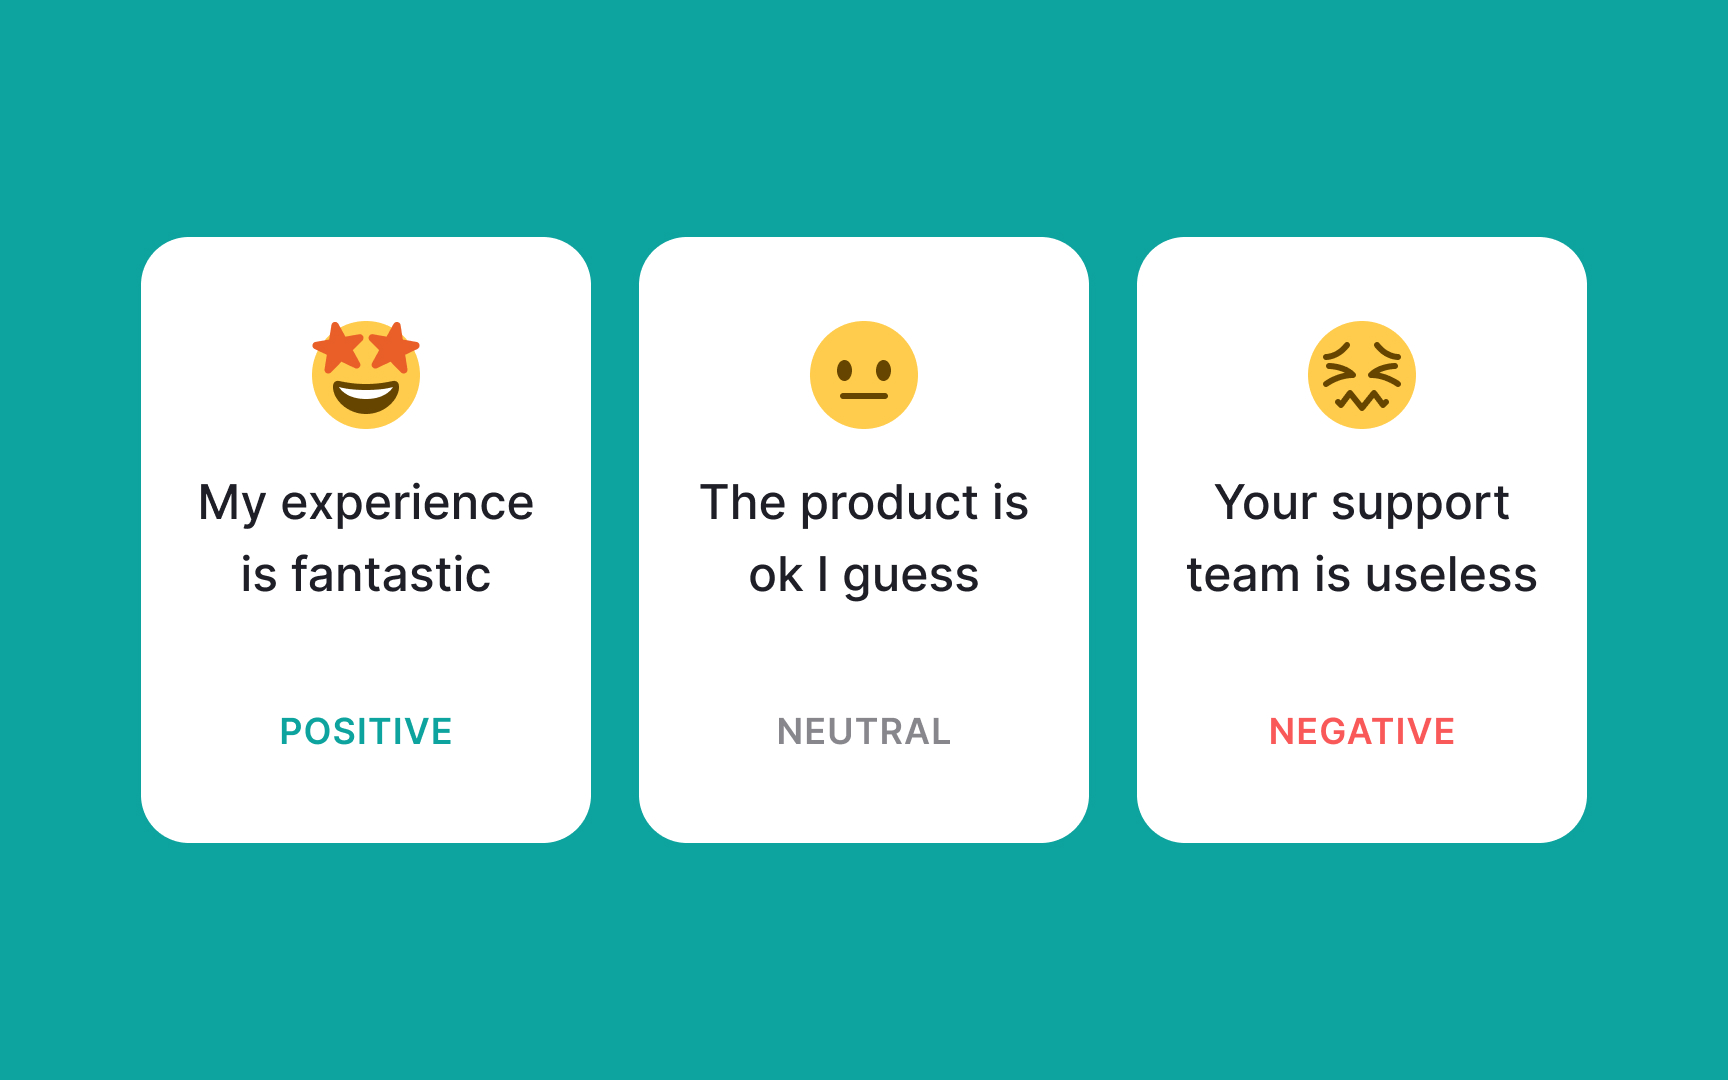
Sentiment tracking analyzes customer emotions and attitudes through their
Machine learning algorithms go beyond basic sentiment classification to identify specific themes and emotions. They detect frustration, delight, confusion, or appreciation in customer communications, providing nuanced insight into the emotional journey. Advanced systems can even track sentiment changes over time, showing how customer attitudes evolve through different product experiences.
Real-time sentiment tracking enables immediate response to customer dissatisfaction. By monitoring sentiment across channels, teams can quickly identify and address emerging issues before they escalate. The technology also helps prioritize product improvements by highlighting features that consistently generate positive or negative emotional responses.
Pro Tip: Combine sentiment tracking with customer journey mapping to identify emotional highs and lows throughout the user experience.
Satisfaction segmentation divides customers into distinct groups based on their satisfaction levels and behavior patterns. This advanced analysis combines multiple satisfaction metrics with usage data, creating detailed profiles of customer satisfaction types.
Typical segments might include:
- Power users with high satisfaction
- Casual users with moderate satisfaction
- At-risk users showing declining satisfaction
- Detractors actively expressing dissatisfaction.
Effective segmentation requires analyzing patterns across various data points. User engagement metrics, feature adoption rates, and support
Machine learning algorithms can automatically identify emerging segments and predict satisfaction trajectories. By tracking segment changes over time, teams can spot early warning signs of customer dissatisfaction and take proactive steps to improve experiences.
Improvement tracking measures the impact of product changes on customer satisfaction over time. The process combines satisfaction metrics with product analytics to create a closed feedback loop between customer feedback and product development. Each improvement initiative gets tracked through multiple metrics — satisfaction scores before and after changes, user adoption rates of new features, and impact on support ticket volumes.
Effective improvement tracking requires establishing clear baseline measurements. Teams should monitor key satisfaction indicators during the pre-change period, implement improvements, then measure post-change impact across multiple timeframes. This systematic approach helps quantify the ROI of customer satisfaction initiatives and validates the effectiveness of product decisions.
Modern product analytics platforms enable granular tracking of improvement impacts. Teams can monitor how specific user segments respond to changes, identify any unintended consequences, and measure the compound effect of multiple improvements. Historical tracking data helps teams predict which types of improvements will have the greatest satisfaction impact, leading to more efficient resource allocation and faster satisfaction gains.
References
- What is a Good Net Promoter Score? (2024 NPS Benchmark) | Retently CX
- How to Improve CSAT: 10 Tested and Proven Ways | Thoughts about Product Adoption, User Onboarding and Good UX | Userpilot Blog
Topics
From Course

Share


Similar lessons

Analytics Strategy & Planning
Data Collection & Tracking
