Customer Journey Analytics
Discover the best practices for tracking and analyzing user paths to optimize product experiences
While funnel analysis tracks linear conversion paths, customer journey analytics reveals the complex, non-linear ways users interact with products across multiple touchpoints and timeframes. This sophisticated approach maps cross-channel behavior patterns, recurring interactions, and diverse pathways that traditional funnel tracking might miss. By connecting data points like feature usage, support interactions, and cross-device sessions, product teams can uncover how users actually navigate their product ecosystem beyond prescribed conversion steps.
Modern journey analytics tools use machine learning to identify common patterns, segment user behaviors, and highlight unexpected paths that impact retention and satisfaction. Understanding these comprehensive journeys helps teams optimize not just conversion rates, but the entire product experience across different user segments and use cases. The insights from journey analytics enable businesses to move beyond simple funnel optimization to create more nuanced, personalized experiences that accommodate diverse user paths and preferences.
Journey map tracking is a way to record how users move through your product. Instead of guessing user paths, tracking shows you exactly what users do. You can see which features they use, how long they spend, and where they leave. Having this data helps teams make better decisions about product improvements and feature priorities.
Looking at tracked journeys helps teams understand their users better. You can see common paths that lead to success, spot where users get stuck, and find ways to improve the product experience. Teams can use this information to fix problem areas, make popular features even better, and create smoother paths to important actions like purchases or subscriptions. Understanding real user behavior through tracking also helps teams focus on changes that will have the biggest impact on user success.
Touchpoints are every
Tools like Amplitude and Heap automatically capture these touchpoints as they happen. For instance, if users browse your product catalog, the tracking shows which categories they viewed at 2:15 PM, that they filtered by price at 2:17 PM, and sorted by ratings at 2:20 PM — all from their iPhone. This detailed context helps understand user decision-making.
Analyzing touchpoint data reveals important behavior patterns. For example, a fashion app might discover that users who use the virtual try-on feature are 3x more likely to purchase. An education app might find that users who complete lessons in the morning have higher completion rates. Teams can use these insights to improve features that matter most to users and remove friction points that cause drop-offs.
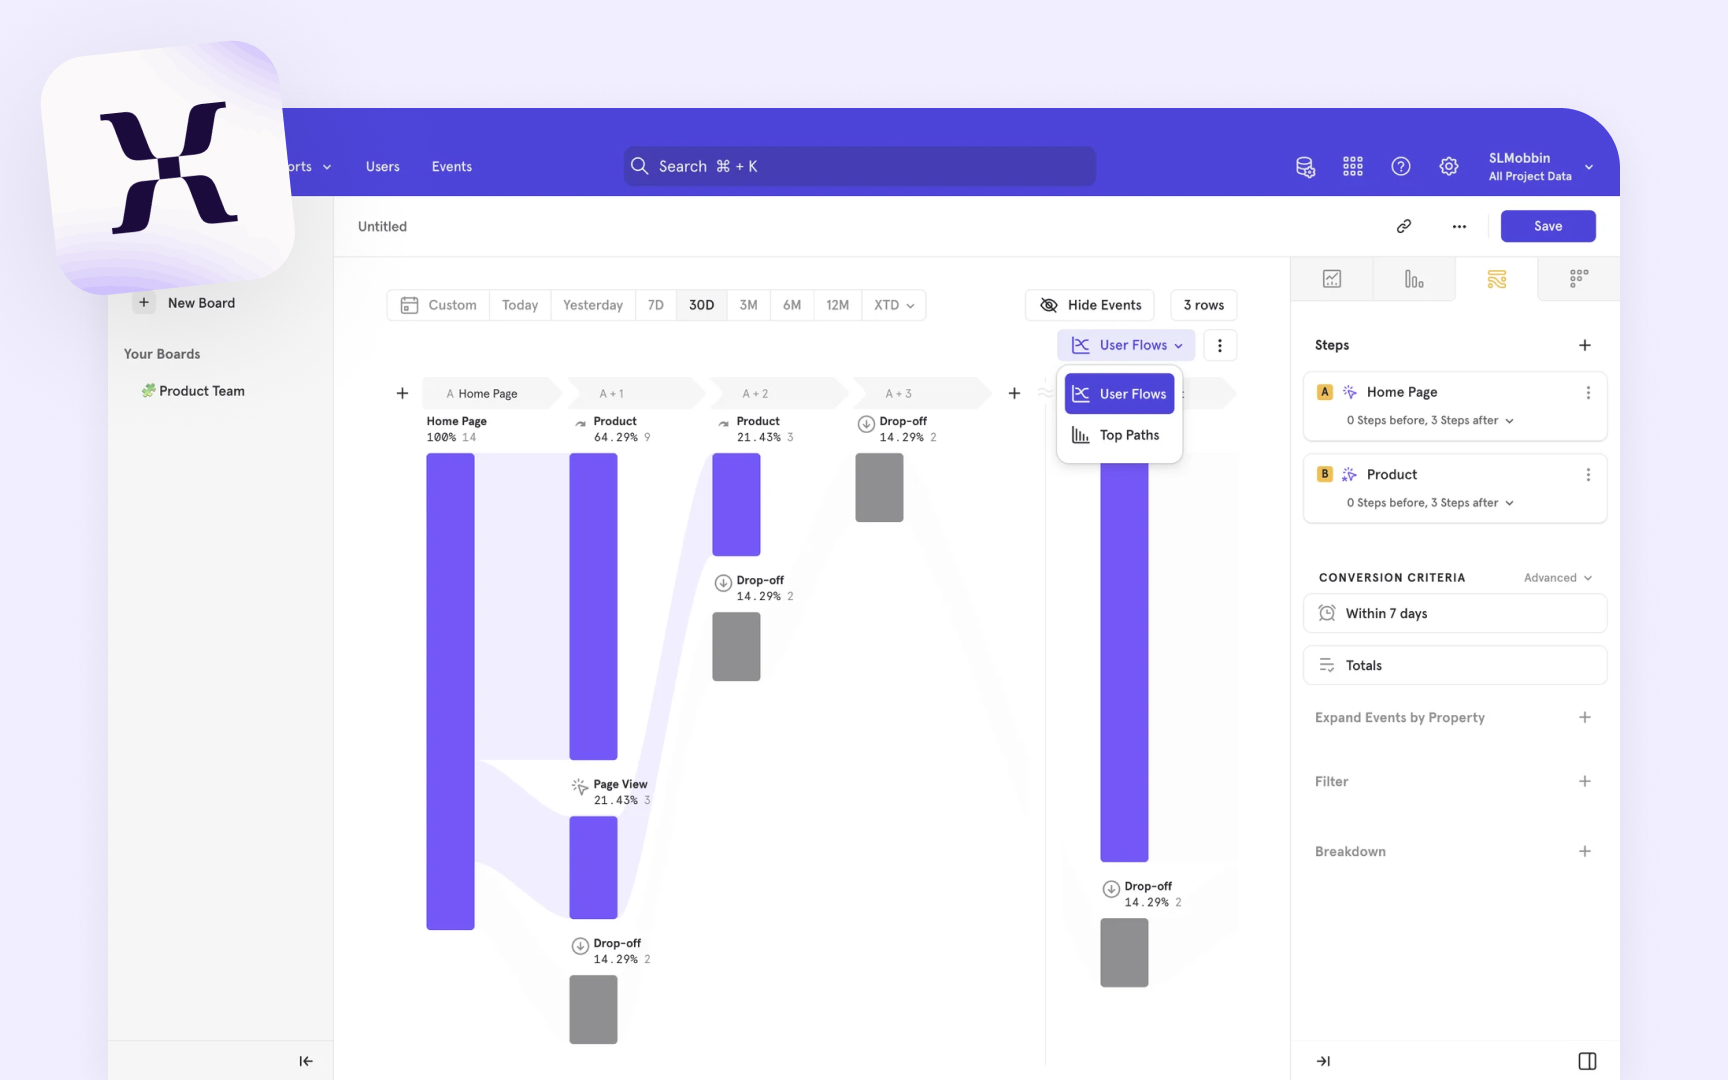
Flow visualization turns complex user journey data into clear, visual paths. Tools like Google Analytics and Woopra transform thousands of user sessions into sankey diagrams (visual maps where wider paths show more users taking that route) or tree maps showing how users navigate. For example, you might see that 70% of users go from your landing page to
Modern visualization tools offer interactive features for deeper analysis. Using Mixpanel, you can click on any path to see detailed metrics like time spent, drop-off rates, and user segments. This helps identify patterns — like discovering that users who visit your help center within their first week are 2x more likely to become paying customers.
Product teams can use these visualizations to spot opportunities and problems. A SaaS product might notice that users who customize their dashboard settings show higher engagement. An e-commerce site might find that users who start from category pages convert better than those who use
Journey stage metrics measure how customers move through different phases of their relationship with your product. Think of these stages like checkpoints in a race: awareness (discovering your product), consideration (comparing options), purchase (buying), and
Basic metrics include how many people enter each stage and how many move forward to the next one. For example, out of 100 people who discover your product, you might track how many visit your
Understanding these metrics helps identify which stages need improvement. If many customers leave during the consideration stage, you might need clearer product information or better pricing explanations. Regular tracking of these numbers helps spot problems early and shows if your improvements are working.
Cross-device journeys track how customers interact with your product across different devices like phones, tablets, and computers. For example, many customers often start browsing on their phone during a commute, continue research on their work computer, and make final decisions on their home laptop. Understanding these patterns helps create a smoother experience across all devices.
User identification methods like login systems or device fingerprinting help connect these scattered
The key challenge lies in maintaining consistent data collection across devices while respecting user privacy.
Channel attribution answers a simple question: "How did customers find us?" It's like tracing the path a customer took to reach your product. Did they click on a Google ad? Find you on Facebook? Or hear about you from a friend?
Different attribution models assign value to channels in various ways. The simple "last click" model gives all credit to the final touchpoint before conversion. More advanced models, like "linear" or "time decay," distribute credit across multiple channels.[2] For example, if a customer visited through social media, then through Google
Accurate attribution helps allocate marketing budgets more effectively. If social media consistently starts customer journeys that end in conversion through other channels, it might deserve more investment than pure conversion numbers suggest.
Journey friction points are obstacles that make it harder for customers to achieve their goals. These are like speed bumps in your customer's path — places where they get stuck, confused, or leave. Common friction points include slow loading pages, complicated checkout processes, or confusing navigation.
By looking at your analytics data, you can spot where customers typically run into trouble. For example, if many people abandon their shopping cart at the shipping information
Finding these problems is the first step to fixing them. Simple changes like clearer buttons, better error messages, or fewer form fields can make a big difference. Regular checking of your analytics helps catch new friction points early, keeping your customer journey smooth.
Micro-conversions are the small steps customers take before making a final purchase or major action.[3] These are like breadcrumbs that lead to your main goal. Common examples include newsletter signups, adding items to a wishlist, downloading a guide, or watching a product video.
Tracking these small actions helps predict which customers are most likely to convert. For instance, someone who reads your blog, then downloads a guide, and joins your newsletter is showing clear interest. Each micro-conversion adds up to tell a story about customer engagement and interest level.
Monitoring these smaller steps reveals which actions most often lead to sales. If 70% of customers who watch your product demo later make a purchase, you know that video is an important part of the journey. This insight helps you encourage more customers to take these helpful small steps.
Pro Tip: Pick 3-4 key micro-conversions to track at first — focus on actions that show clear customer intent, like signing up for a trial or adding items to cart.
User state transitions show how customers move between different stages of engagement with your product. Think of states as different levels of involvement: visitor, free trial user, paying customer, or inactive user. Tracking these changes helps understand how users progress or drop off. Each transition between states tells an important story. For example, moving from free trial to paid customer is a positive transition, while going from active to inactive signals potential churn. By measuring how long users stay in each state and what triggers changes, you can spot patterns that lead to success or problems.
Understanding these patterns helps you take action at the right time. If users often become inactive after 3 months, you can plan engagement activities at month two. Similarly, if most successful customers upgrade within the first week of their trial, you can focus on making that first week experience better.
Pro Tip: Set up alerts for important negative state changes (like becoming inactive) so you can respond quickly and try to re-engage those users.
References
- Customer Journey Stages | Segment
- Macro vs. Micro Conversions | Nielsen Norman Group
Topics
From Course

Share


Similar lessons

Analytics Strategy & Planning
Data Collection & Tracking
