Cohort & Segment Analysis
Explore the basics of cohort and segment analysis to unlock actionable insights from user behavior patterns
Cohort and segment analysis reveal patterns in user behavior across different groups and time periods. By breaking down users into meaningful segments based on shared characteristics or behaviors, product teams gain insights into retention, engagement, and conversion patterns that would otherwise remain hidden in raw data. Cohort analysis tracks how specific user groups perform over time, illuminating critical patterns in user lifecycle, feature adoption, and customer journey touchpoints.
Understanding these analytical approaches helps identify opportunities for product improvements, optimize user experiences, and drive strategic growth initiatives. Through careful examination of user segments and cohorts, teams can pinpoint which features resonate with specific user groups, when engagement typically drops, and what distinguishes successful users from those who churn. This targeted analysis enables products to evolve based on concrete user behavior rather than assumptions, leading to more impactful product decisions and improved user satisfaction.
Cohorts and segments represent distinct ways to group and analyze users based on shared characteristics or behaviors. Cohorts specifically focus on users who share a common experience or action during the same time period, like signing up in January 2024 or activating a specific feature within their first week.
Segments divide users based on specific attributes or behaviors, regardless of timing. These could include demographic factors like location and age, or behavioral patterns like feature usage frequency and subscription status. This granular grouping enables product teams to identify patterns that might be invisible when looking at the overall user base.
Understanding these grouping methods helps teams track how different user subsets interact with products over time, measure the impact of product changes, and identify opportunities for targeted improvements. The key difference lies in timing — cohorts emphasize temporal relationships while segments focus on characteristic-based groupings.
Behavioral cohorts group users based on specific actions they take within a product during a defined timeframe. These actions might include completing an onboarding tutorial, making a first purchase, or reaching a certain usage threshold within their first month. This grouping reveals how early behaviors influence long-term engagement and success.[1]
Product teams use behavioral cohorts to identify which initial actions correlate with higher
Focus on behaviors that directly relate to your product's core value proposition — these actions often serve as the strongest predictors of long-term user success. For example, in a fitness app, prioritize tracking workout completions and goal achievements over secondary behaviors like profile customization or social sharing.
Time-based cohorts organize users by when they first joined or started using a product, typically grouped by day, week, month, or quarter. This chronological grouping allows teams to detect patterns in user behavior and product performance across different time periods. Each cohort experiences the product under unique circumstances — different features, market conditions, or seasonal factors.
When analyzing time-based cohorts, teams can identify how product changes impact newer versus older users. For example, comparing
Time-based cohort analysis also excels at revealing gradual changes in product performance and user behavior patterns. Teams can spot trends like declining retention in recent cohorts, seasonal variations in user engagement, or improvements in activation rates following product updates.
Acquisition cohorts classify users based on how they discovered and started using a product. This analysis reveals which acquisition channels, campaigns, or referral sources lead to the most valuable and engaged users over time. Whether users arrive through paid advertising, organic search, social media, or referrals, their entry point often influences their understanding of the product's value and their subsequent behavior patterns.
Different acquisition sources can attract users with varying needs and expectations. For example, users who discover a product through detailed comparison reviews might show higher
Acquisition cohort analysis can help optimize marketing spend and user
Pro Tip: Track not just the channel, but also the specific messaging or campaign that attracted users — it helps align product experiences with the promises made during acquisition.
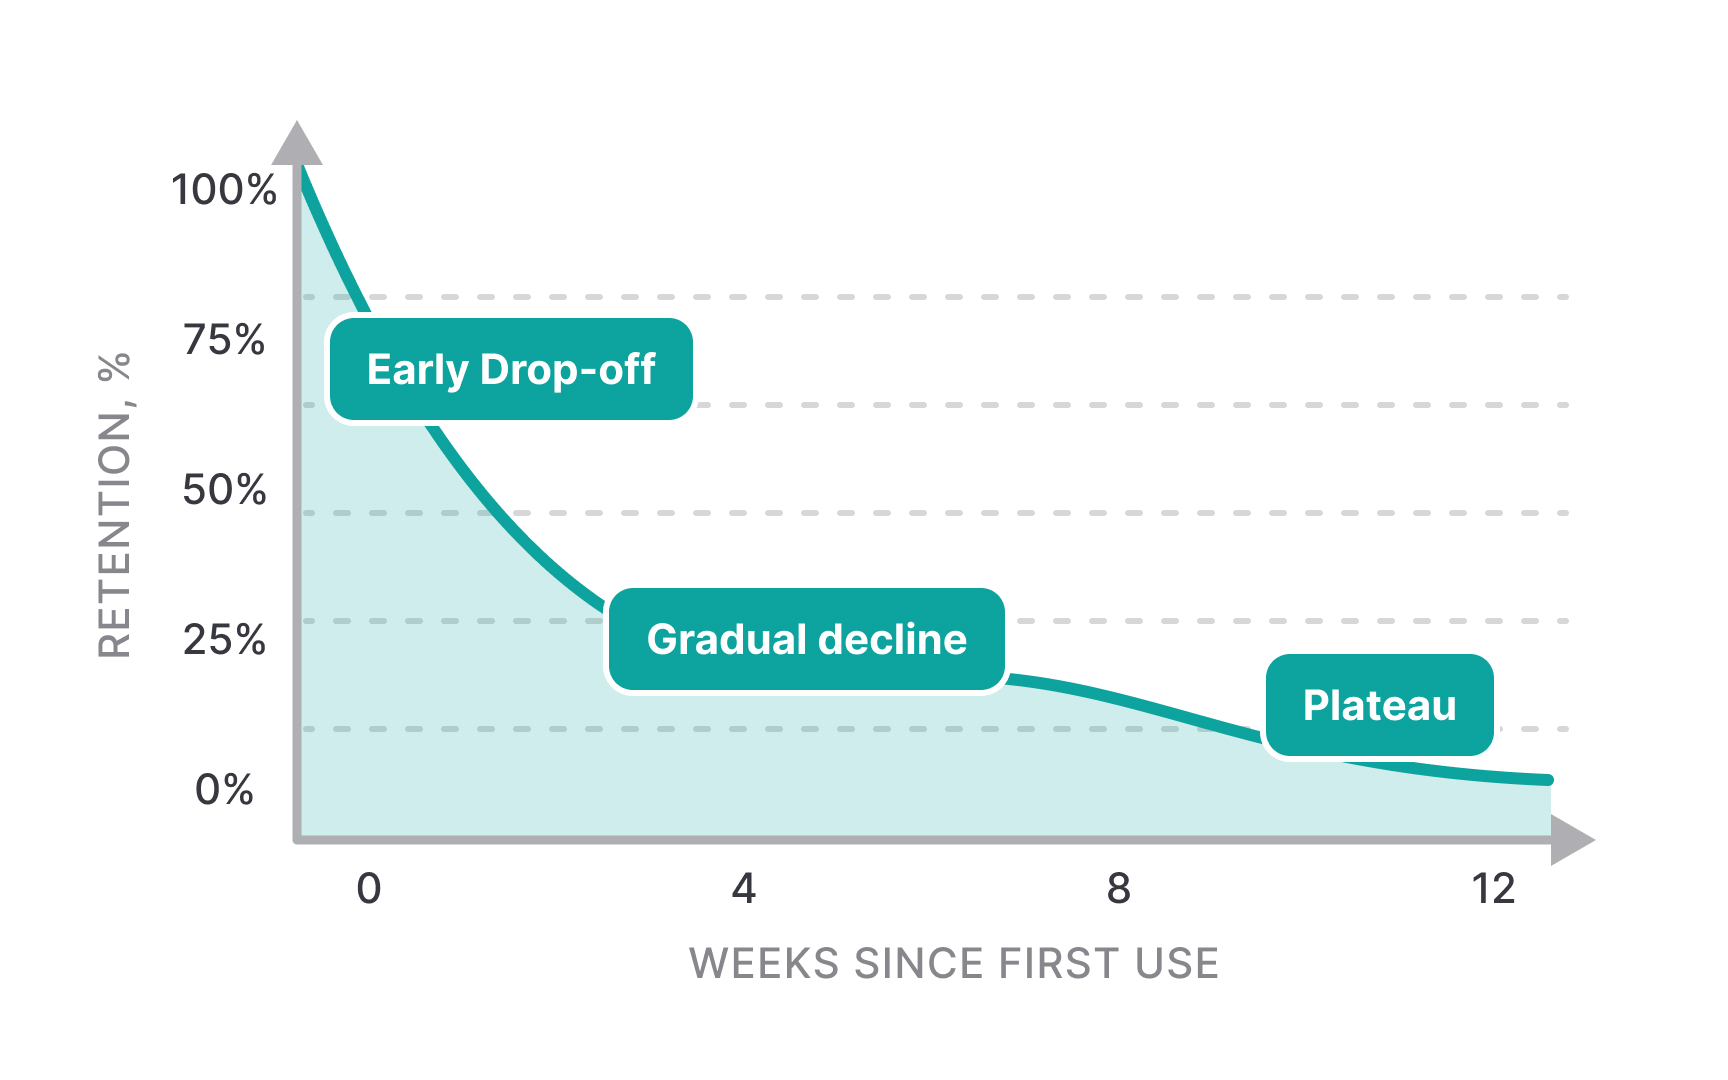
The curve's shape varies significantly across different product types and user segments. For example, B2B software might show higher retention rates but slower initial adoption compared to consumer apps. Understanding these patterns helps set realistic benchmarks and identify opportunities for improvement at specific points in the user journey.
Analysis of retention curves often reveals 3 distinct phases:
- Early user drop-off during onboarding
- Medium-term engagement challenges
- Stable cohort of loyal users
By examining where the curve flattens and comparing curves across different user segments, teams can identify which user groups find sustainable value in the product and optimize experiences to help more users reach this stable phase.
Pro Tip: Look for "shoulder" points in retention curves where the drop-off rate changes significantly — these often indicate critical moments in the user journey.
Different retention metrics reveal unique patterns in user engagement:
- N-day
retention measures if users return on a specific day (like day 7 or day 30). - Weekly retention tracks returns within each week, showing usage patterns tied to business cycles.
- Monthly retention helps understand longer-term engagement, especially useful for products that don't need daily use.
- Custom retention metrics match your product's natural usage patterns. A meal planning app might care about Sunday planning sessions, while a project management tool focuses on weekday activities.
This alignment helps set realistic retention goals and identify true engagement issues. Also remember, raw numbers tell only part of the story — comparing retention across different user groups usually reveals deeper insights. For example, new users might show different patterns than long-term users, paid users might retain better than free users. These comparisons help identify which user segments find lasting value in your product.
Product teams typically create different types of user segments to understand their user base:
- Demographic segments help tailor
marketing messages and localize features (e.g., European users prefer different payment methods than US users). - Behavioral segments inform feature development (e.g., users who export data weekly need batch processing features).
- Value-based segments guide monetization strategies (e.g., teams with > 100 members need advanced admin controls).
- Technographic segments influence technical decisions (e.g., mobile-heavy users need offline capabilities).
- Engagement segments help prioritize
retention efforts (e.g., users who perform > 5 core actions per week have 80% better retention).
Each segment type serves different analytical purposes, from feature prioritization to marketing campaigns. Strong segments need clear boundaries anyone can understand. Use simple rules like " active users are those who have logged in within 7 days" rather than complex formulas. Make sure the segments are mutually exclusive and include enough users to show real patterns — having too many small segments can make analysis misleading and ineffective.
Segment activation tracking measures how different user groups reach key milestones in their product journey. Each segment might have unique activation events that signal true product adoption. A design tool might see professional users activate by importing brand assets, while amateur users activate by using basic templates.
Teams can use activation metrics to spot where specific segments struggle or succeed. By tracking these patterns, you can create targeted
Watch how quickly different segments reach their activation moments. Slow activation often signals that users don't understand your product's value or face obstacles in their early experience. Fast activation typically leads to better
Pro Tip: Create segment-specific activation goals based on what success looks like for each user group, rather than using one-size-fits-all metrics.


Similar lessons

Analytics Strategy & Planning
Data Collection & Tracking
