Predictive Analytics and Machine Learning for Churn
Learn to predict and prevent customer churn using machine learning and data analytics.
Predictive analytics and machine learning have revolutionized how businesses approach customer churn. These advanced techniques allow companies to anticipate potential customer loss before it occurs, enabling proactive retention strategies. By analyzing vast amounts of user data, including behavioral patterns, engagement metrics, and historical trends, machine learning models can identify subtle indicators of impending churn that might be invisible to human analysts. This predictive power transforms churn management from a reactive to a proactive process, significantly improving retention rates and customer lifetime value. From feature engineering to model selection, and from data preprocessing to result interpretation, the field offers a rich set of tools and methodologies.
As businesses increasingly recognize the cost-effectiveness of retention over acquisition, mastering these techniques becomes crucial for maintaining a competitive edge in today's data-driven marketplace. The intersection of big data, statistical analysis, and artificial intelligence opens new possibilities for understanding and influencing customer behavior, making predictive churn analytics an essential skill for modern business strategists and data scientists alike.
Predictive analytics for
Key components of predictive churn analytics include:
- Historical data: Past customer behavior and interactions
- Features: Relevant characteristics that might indicate churn risk
- Machine learning models: Algorithms that learn patterns from data
- Predictions: Estimates of customers’ likelihood to churn
For example, a subscription service might use data on usage frequency, customer support interactions, and payment history to predict churn risk.
Understanding these basics is crucial for developing effective churn prevention strategies.
Effective
Common data sources for churn prediction include:
- Usage logs: Frequency and patterns of product or service use
- Customer support interactions: Tickets, chat logs, and call records
- Transaction history: Purchase frequency, amounts, and types
- User feedback: Survey responses and product ratings
- Account information: Sign-up date, plan type, and demographic data
For instance, a mobile app might analyze daily active users, feature usage, and in-app purchase history to predict churn likelihood.
Combining multiple data sources often leads to more accurate churn predictions.[1]
Pro Tip: Regularly audit and update data sources to ensure they remain relevant and comprehensive.
Getting data ready for
Key steps in data preprocessing include:
- Cleaning data: Fix errors, remove duplicates, and fill in missing information
- Scaling numbers: Adjust numerical values to a common scale
- Converting categories: Change text categories into numbers
- Balancing data: Ensure fair representation of churned and non-churned users
- Creating time features: Make new data points based on historical patterns[2]
For instance, an e-commerce team might turn purchase dates into "days since last purchase" or change product types into number codes.
Feature engineering involves creating new, meaningful data points from existing information. It's typically done by data scientists or analysts, not product developers. Those features are new ways of looking at existing data to better predict
Key aspects of this process include:
- Time-based insights: Create data points like "days since last login"
- Behavior patterns: Develop metrics that show how engaged users are
- Data summaries: Combine information over weeks or months
- Combined insights: Mix different data types to create new information
- Industry-specific metrics: Create data points unique to your product type
For instance, a music streaming service might create a data point for "percentage of skipped songs" or "listening time trend over the last month."
Good feature creation can make churn prediction models much more accurate.[3]
Pro Tip: Work with people who know your product well to identify valuable data points that aren't obvious at first glance.
Picking the best method to predict
Common prediction methods for churn include:
- Simple prediction: Easy to understand, clearly shows what factors matter most
- Decision tree methods: Handle complex data well, show factor importance visually
- Deep learning: Can spot complex patterns, but works like a "black box"
- Nearest neighbor method: Predicts based on similar cases, good for spotting local patterns
- Support vector method: Good at finding clear boundaries between groups, but hard to interpret
The choice depends on your needs. If you want to understand why customers churn, simple methods work best. For pure prediction accuracy, complex methods might be better.
For example, a telecom company might use simple prediction to clearly see why customers leave, even if it's slightly less accurate than complex methods.
Creating a simple
Key steps in building a basic churn prediction system include:
- Splitting data: Divide your dataset into two parts - one for teaching and one for testing
- Selecting important information: Choose the most relevant data points for prediction
- Choosing a simple method: Start with an easy-to-understand approach like simple probability calculations
- Teaching the system: Use the teaching data to help the system learn patterns of churn
- Testing predictions: Apply the trained system to the test data to see how well it predicts churn[4]
For example, an e-commerce site might feed data on purchase frequency, time since last purchase, and customer service
Pro Tip: Focus on understanding why the system predicts churn. This is often more valuable than pure accuracy at first.
After building a
Key aspects of evaluating churn prediction performance include:
- Accuracy metrics: Measure how often the system correctly predicts churn
- Confusion matrix: Shows true positives, false positives, true negatives, and false negatives
- ROC curve: Illustrates the trade-off between correctly identifying churners and non-churners
- Cross-validation: Tests the system on different subsets of data to ensure consistent performance
For example, a
Understanding these metrics helps in refining the prediction system and setting realistic expectations.[5]
Pro Tip: Pay attention to both precision (avoiding false alarms) and recall (catching actual churners). The balance depends on your business goals.
Understanding what your
Key aspects of interpreting churn prediction results include:
- Identifying top churn factors: Pinpoint the main reasons customers are likely to leave
- Segmenting at-risk customers: Group potential churners based on common characteristics
- Quantifying potential losses: Estimate the financial impact of predicted churn
- Spotting trends: Notice patterns in churn likelihood over time or across customer groups
- Linking to business metrics: Connect churn predictions to key performance indicators
For instance, an online learning platform might discover that users who don't complete their first course within 30 days are 70% more likely to churn.
These insights help shape targeted
Pro Tip: Share insights in simple, non-technical language to ensure all team members understand and can act on the findings.
Real-time
Key aspects of real-time churn prediction include:
- Continuous data processing: Analyze customer behavior as it happens
- Quick response triggers: Set up alerts for when a customer's churn risk increases
- Integration with customer touchpoints: Connect predictions to customer service or marketing systems
- Scalable infrastructure: Ensure your system can handle large volumes of real-time data
- Automated decision-making: Set up rules for immediate actions based on churn risk levels
For example, a mobile game might trigger a special offer when it detects players’ engagement dropping sharply.
Turning
Key steps in using predictive insights for retention include:
- Prioritizing at-risk customers: Focus efforts on those most likely to churn
- Tailoring interventions: Create specific retention actions for different customer groups
- Timing outreach: Reach out to customers at the right moment based on predictions
- Testing and refining: Continuously assess which retention strategies work best
- Measuring impact: Track how well your retention efforts reduce actual churn rates[6]
For instance, a
Using data to guess what customers will do raises important questions about right and wrong. We need to balance the good things about predicting
Key ethical points to think about include:
- Protecting data: Use customer information carefully and only if they've said it's okay
- Being open: Tell customers how you're using their information
- Staying fair: Make sure your guesses don't unfairly pick on certain groups
- Keeping data safe: Protect customer details from theft or misuse
- Letting people opt out: Give customers a choice about how you use their data
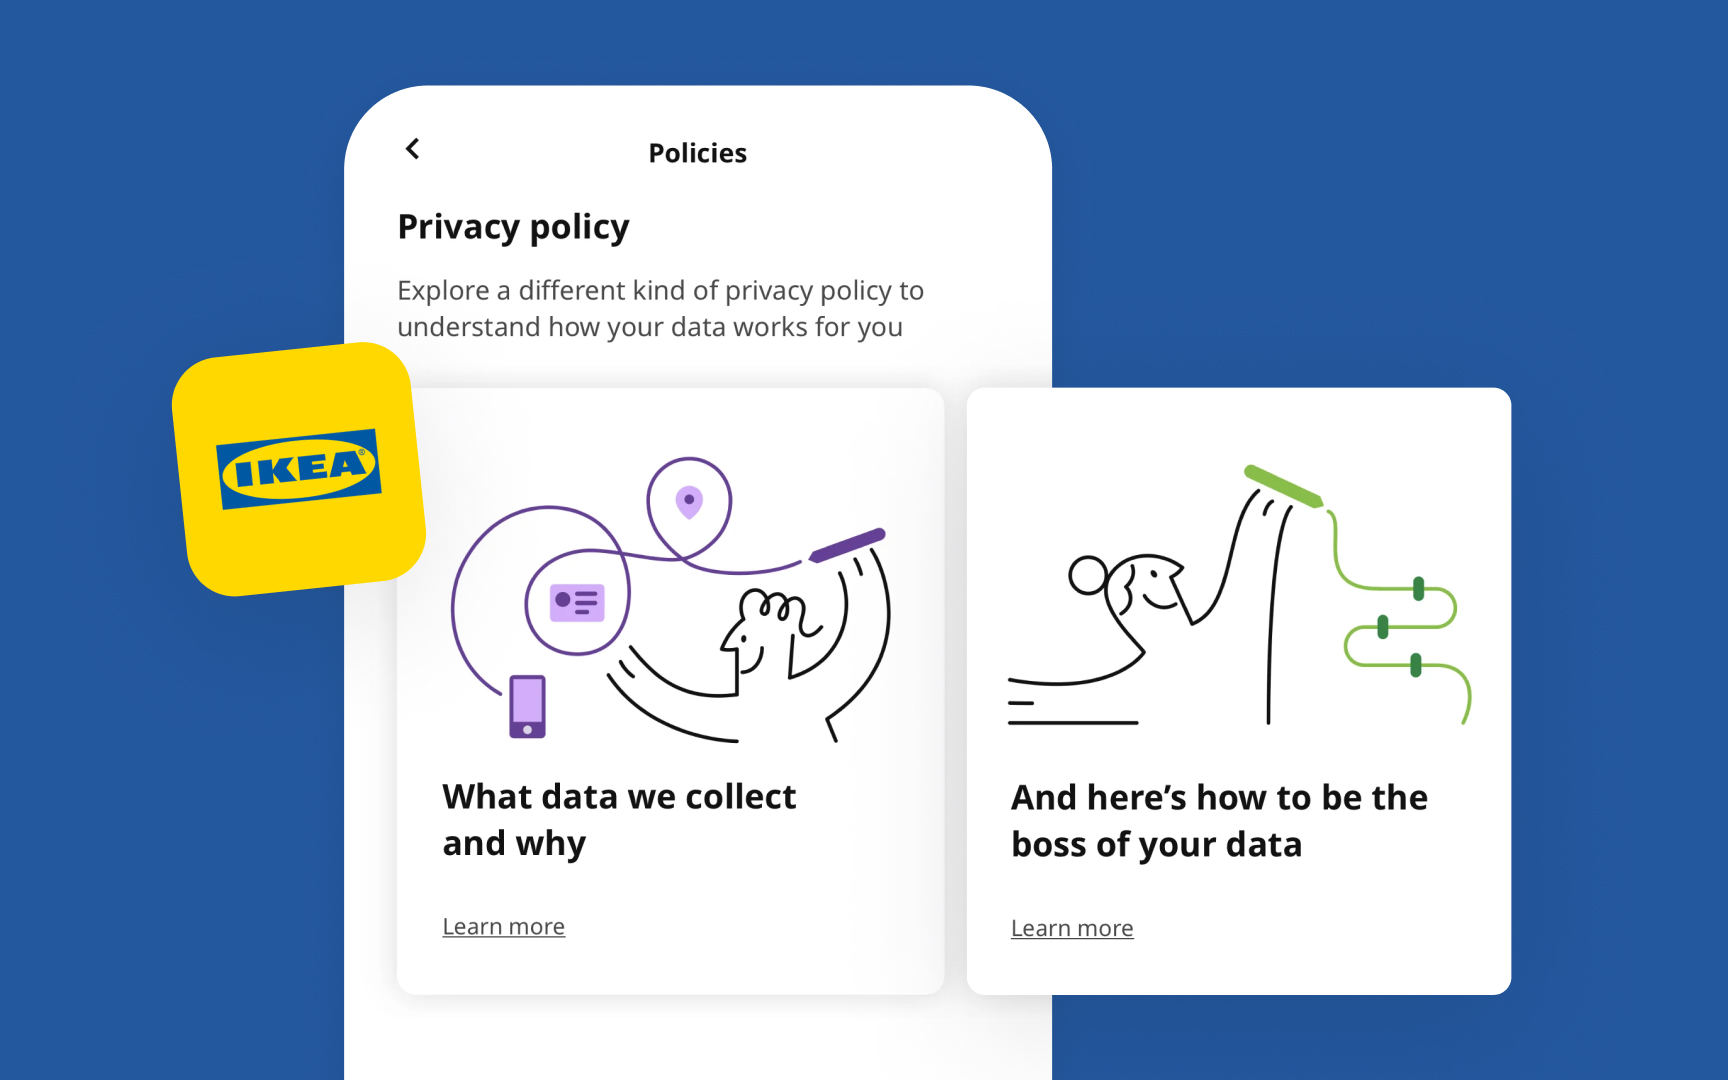
For instance, IKEA demonstrates ethical data handling by clearly explaining their data collection and giving users control over their information. Their simple illustrations and friendly language make privacy policies easy to understand and build customer trust.
References
- Data Preprocessing in Data Mining | SpringerLink
- Hands-On Machine Learning with Scikit-Learn, Keras, and TensorFlow, 2nd Edition | O’Reilly Online Learning
Topics
From Course

Images provided by

Share


Similar lessons

AI’s Role in Text Generation and Modification

Best Practices and Potential Pitfalls of AI Writing Tools
