Implementing Early Warning Systems
Build predictive systems to identify at-risk customers before they churn.
Early warning systems help businesses spot customers who might leave, letting teams step in before it's too late. These systems work by watching how customers use your product, tracking their engagement, and measuring their satisfaction to predict who's likely to cancel. They combine what's happening right now with past customer patterns to turn data into clear action steps.
Companies use these systems to keep communication open, fix problems quickly, and show customers their value.
Setting up these warning systems needs both technical tools and an understanding of how customers think and act. Good warning systems look at many different signals — from what customers tell you directly to small changes in how they use your product — to build a complete picture of customer health.
These tools do more than just prevent customers from leaving — they show you trends in customer happiness and point out where your product could be better. Because these systems work in real-time, teams can step in quickly to help, turning risky situations into chances to make customer relationships stronger and improve what you offer them.
Early warning indicators are measurable signals that help predict if customers might stop using your product. Like warning lights on a car's dashboard, these indicators alert you to potential problems before they lead to customer churn.
The three main categories of warning indicators are:
- Product usage indicators: Track how customers interact with your product, including login frequency, feature adoption rates, error rates, and time spent in the application. These metrics reveal actual user engagement patterns and potential friction points in the user experience.
- Customer feedback indicators: Monitor direct and indirect customer sentiment through support tickets, NPS scores, and customer satisfaction surveys. These signals help identify frustration points before they escalate.
- Business health indicators: Measure financial and operational metrics like billing status, contract renewals, and account expansion. These indicators show the strength of the business relationship.
Pro Tip: Start by identifying 2-3 indicators that directly show if customers are getting value from your core features.
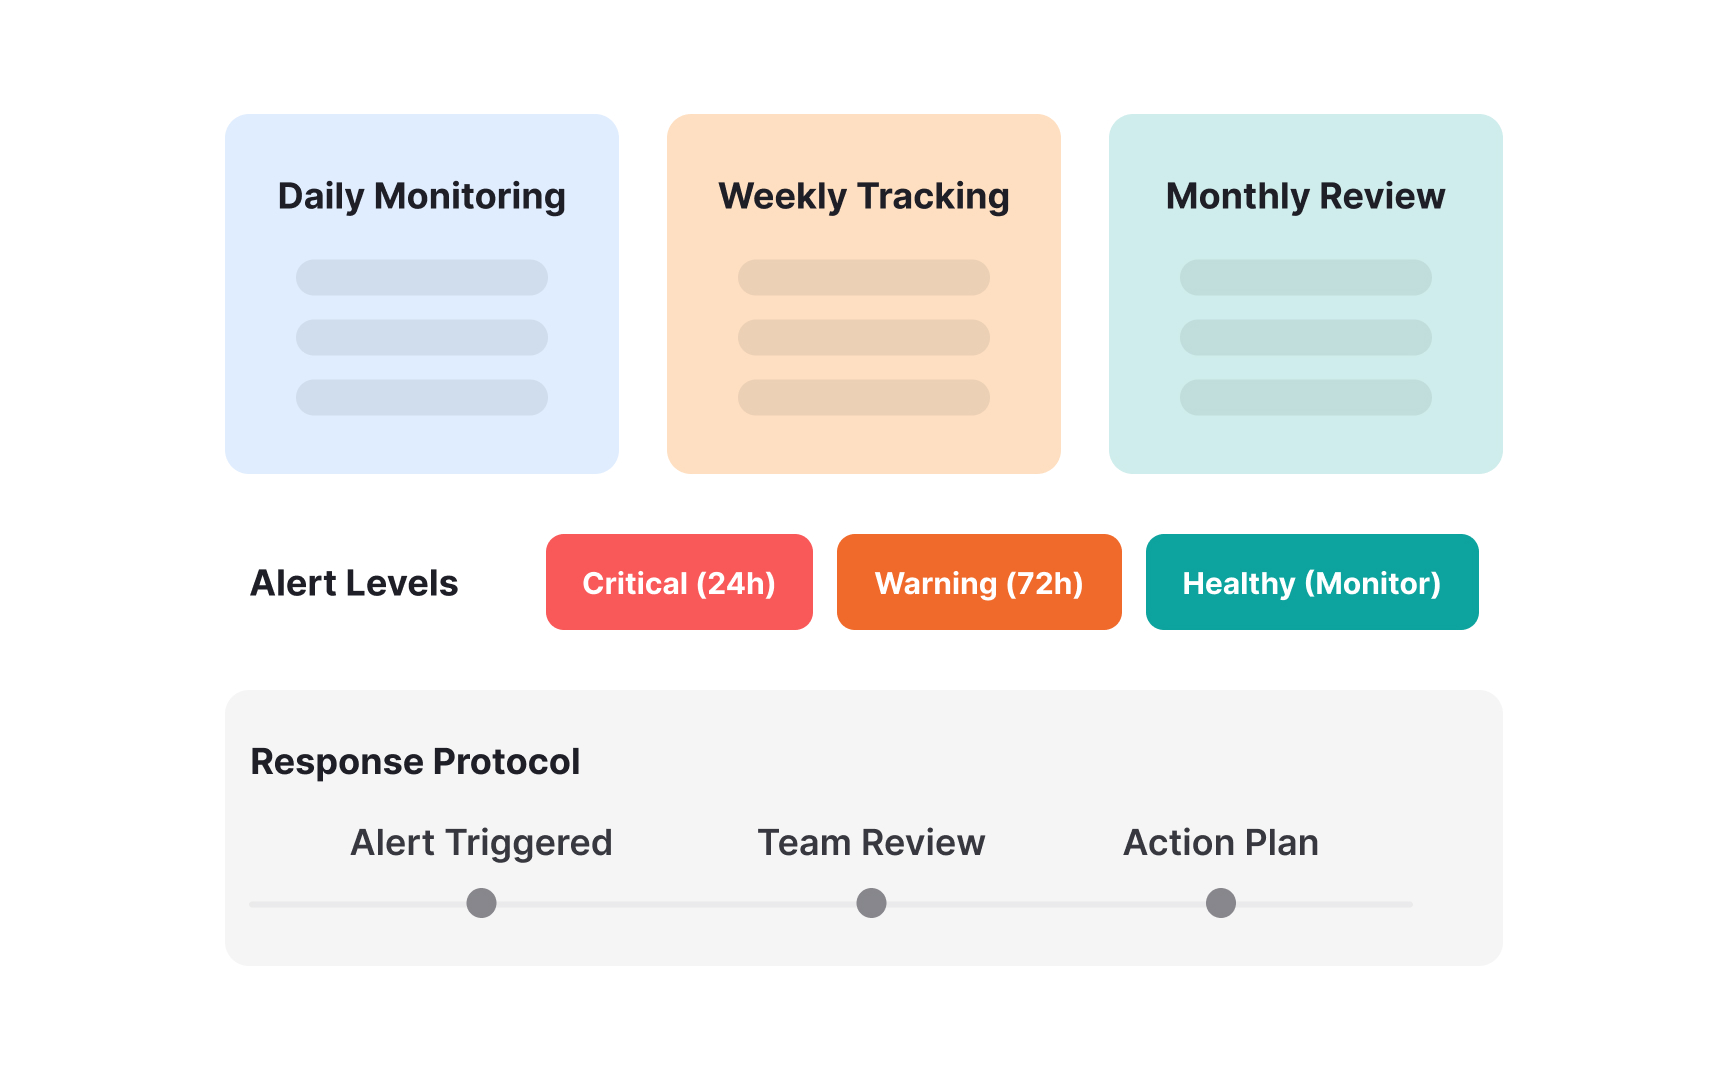
A monitoring framework is a structured system for tracking customer behavior and product usage patterns. It's like creating a comprehensive health monitoring plan that helps you systematically watch for signs of customer success or struggle. Creating an effective framework starts with organizing your monitoring points into clear categories. Consider 3 key areas:
- Product interaction shows how customers use features
- Business milestones demonstrate achieving key goals
- Engagement consistency show patterns over time
Each area needs specific metrics and tracking methods that make sense for your product. Your framework should define what data to collect, how often to check it, and who needs to see different types of information. The key is making it systematic rather than random - every metric should have a clear purpose and fit into your larger monitoring strategy. This organized approach ensures you're tracking the right things consistently rather than getting lost in too much data.[1]
Pro Tip: Create a simple checklist for each timeframe (daily/weekly/monthly) and assign clear owners for each metric check.
Automated tracking is the technical foundation that collects and processes customer behavior data. It's like setting up sensors throughout your product that continuously watch how customers interact with different features and functionalities. Setting up effective tracking requires 3 key technical components:
- Data collection points - specific places in your product where you'll gather information. For example, tracking when users click the 'Export Report' button, how long they spend on the
dashboard , or when they complete their first project. - Processing rules that transform raw data into meaningful insights, like converting individual
login events into a weekly usage pattern, or combining feature usage data to calculate an engagement score. - Integration points that connect your tracking system with tools like Slack for instant alerts, email for automated reports, or CRM systems to update customer health scores.
Your tracking setup should focus on actions that matter most. Rather than tracking everything possible, identify the key features and workflows that successful customers use regularly. This targeted approach helps maintain clean data and makes it easier to spot meaningful patterns in customer behavior.
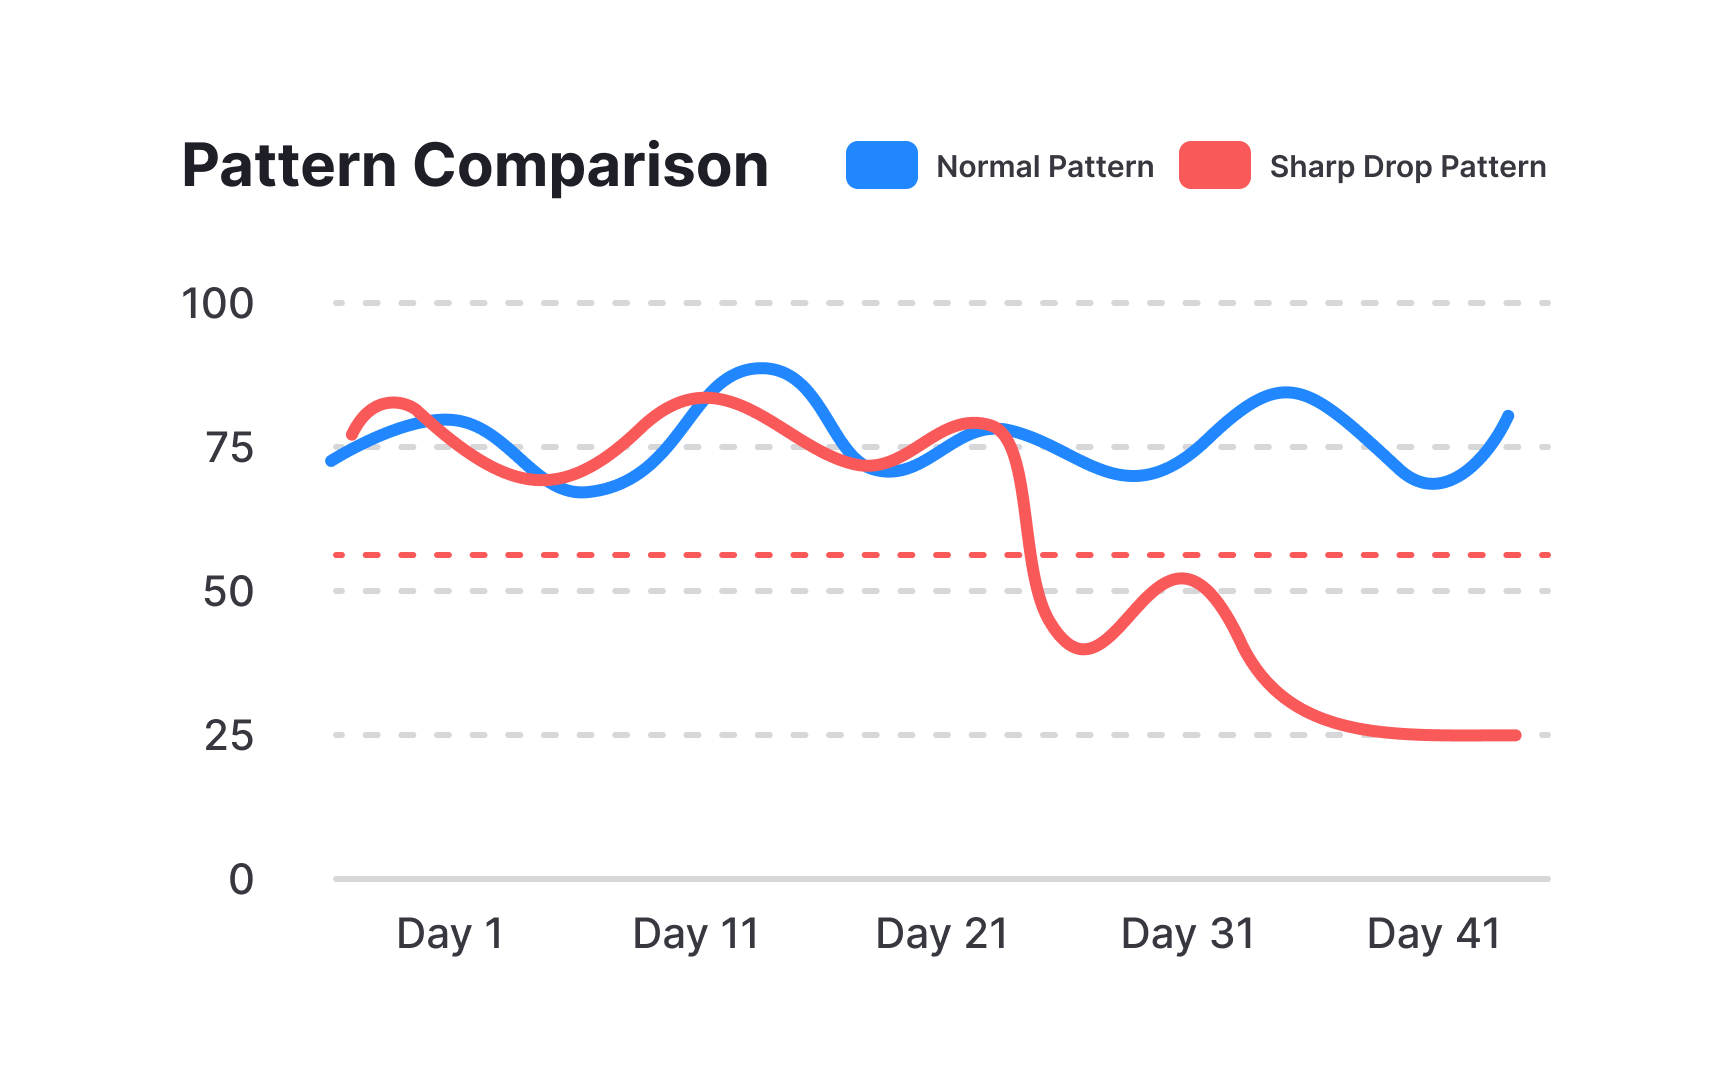
Healthy baselines are standard patterns of product usage that indicate customer success. Think of them as vital signs for your product — just like a doctor knows normal heart rate ranges, you need to know what "normal" looks like for different types of customers.
Creating accurate baselines starts with customer segmentation. Enterprise customers typically show different patterns than small businesses — an enterprise might have 50 active users daily, while a small business has 5. Similarly, new customers’ usage looks different from mature ones. For example, new users might spend more time in tutorials, while experienced users focus on advanced features.
To set meaningful baselines, analyze your most successful customers in each segment. Look at specific metrics like
Pro Tip: Review and update your baselines quarterly — as your product evolves and customers mature, healthy usage patterns often change.
Behavioral patterns are consistent ways customers interact with your product over time. Like vital signs in healthcare, these patterns signal whether customers are thriving or at risk. Understanding these patterns helps predict customer outcomes before obvious problems appear. Common patterns fall into 3 categories:
- Growth patterns show increasing engagement — like users exploring more features or completing tasks faster over time.
- Decline patterns might start subtly — perhaps using advanced features less often or taking longer to complete routine tasks.
- Cyclical patterns reflect natural business rhythms, such as higher usage during certain seasons or days of the week.
Each pattern type needs different interpretation. For instance, a sudden drop in usage from a usually active customer needs immediate attention, while a gradual decline might signal adoption challenges. Similarly, what looks like declining usage might actually be a normal seasonal pattern. Understanding these nuances helps separate real concerns from normal variations.
A scoring model turns customer behavior data into a clear health rating. Like creating a report card, it combines different metrics to show if customers are doing well or struggling. Getting this model right helps teams focus on the customers who need attention most. The most effective scoring models combine 3 types of data with different weights:
- Product usage metrics show how customers use your product's core features — like completion rates of key workflows or usage frequency of essential tools.
- Business metrics track formal indicators like subscription renewals, account expansion, or whether they pay on time.
- Engagement metrics measure how actively customers interact with your company, such as attending product webinars, completing certifications, or responding to your communications.
When creating your model, weight each metric based on how it indicates product success. For instance, in a project management tool, completing projects on time (product usage) might be worth 50% of the score, team size growth (business metric) could be 30%, and certification completion (engagement) might be 20%. These weights should match what truly shows customers are getting value from your specific product.
Action thresholds are trigger points that tell you when to step in and help customers. Like temperature marks on a thermometer, these thresholds clearly show when a situation moves from normal to concerning. Setting the right thresholds helps teams respond at the right time — not too early and not too late.
Every key metric needs its own threshold. For example, if your product is a
Different customer tiers need different thresholds. An enterprise customer using 10% of features might be a crisis, while for a small business it could be normal growth. Similarly, new customers need different thresholds than mature ones — what's concerning for a 2-year customer might be normal for someone in their first month. Update these thresholds regularly based on what you learn from customer patterns.[2]
Pro Tip: Set graduated thresholds - "warning" at 70% of normal usage and "critical" at 50% — to enable early, proactive responses.
Response protocols are step-by-step plans for addressing customer health issues. Having clear protocols helps teams act quickly and consistently when warnings appear. Good response protocols match the urgency of the situation.
For high-urgency issues, like when a major customer's usage drops below critical thresholds, the protocol might include immediate notification to senior management, same-day customer meetings, and rapid technical support.
For moderate concerns, like gradually declining feature usage, the protocol might involve scheduled check-ins and targeted training sessions. Each protocol should define clear ownership and timelines.
For example, when usage drops below 50%, the customer success manager must contact the customer within 24 hours and schedule a health check meeting within the week. The protocol should also include follow-up steps to ensure the intervention worked - like checking if usage improves within two weeks after the meeting.
Pro Tip: Create a shared document of successful interventions and their outcomes — this helps refine your protocols over time.
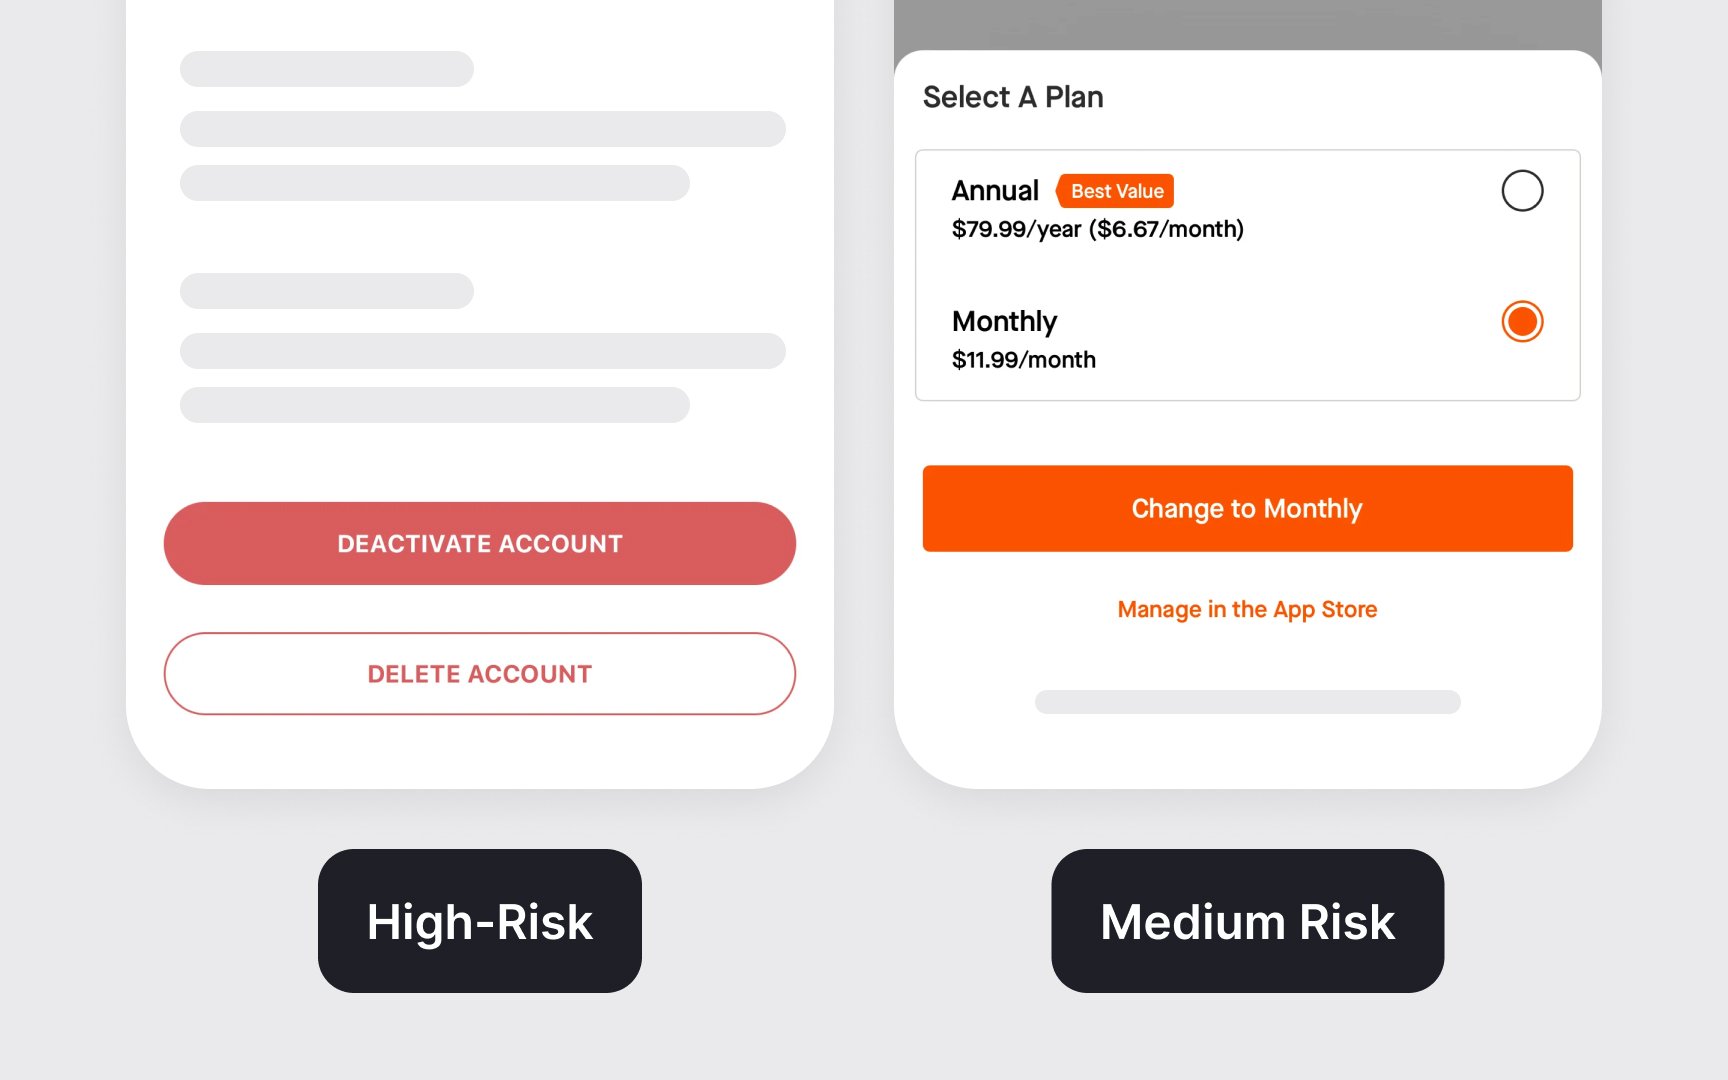
Risk segmentation helps teams prioritize customers based on their likelihood of churning. Risk levels typically fall into 4 categories:
- High-risk customers show critical warning signs such as declining usage, missed milestones, account deletion requests, or unresponsiveness to communications. These accounts need immediate, intensive support with daily check-ins.
- Medium-risk customers display concerning signals like slight usage drops, delayed renewals, or slower feature adoption. They require weekly monitoring and proactive outreach.
- Low-risk customers maintain stable patterns with regular usage and feature adoption but may not be utilizing the product's full potential. Monthly health checks are sufficient.
- Healthy customers show strong engagement through consistent usage, positive feedback, and feature expansion. They're prime candidates for upselling opportunities.
Each risk level needs its own monitoring frequency and response plan. The key is matching your team's effort to the customer's risk level - this helps you use resources efficiently while preventing
Pro Tip: Review risk segments weekly — customers can move between risk levels quickly, and early adjustments are more effective.
Prediction models use historical data to identify customers likely to
- Product usage trends show how deeply customers rely on your product.
- Business signals like company growth or budget changes can indicate future plans.
- Communication patterns, such as response rates to your outreach or engagement with your content, add another layer of insight.
When analyzed together, these signals create a more accurate picture of churn risk. Building these models starts with analyzing past churn cases. Look for common patterns that appeared weeks or months before customers left. For example, you might discover that customers who churn often show reduced feature usage three months prior, or that certain usage patterns predict long-term success. Use these insights to create scoring systems that flag similar patterns in current customers.
Pro Tip: Start with simple models focusing on 3-4 proven indicators before adding complexity — more data isn't always better.
Your early warning system needs regular updates to stay effective. Like updating your phone's software, optimization keeps your system current with changing customer behaviors and business needs. It's an ongoing process, not a one-time setup.
Optimization focuses on 3 main areas.
- Review your alerts — which ones consistently help prevent
churn and which create noise. For example, iflogin frequency alerts rarely predict real problems, adjust or replace them. - Analyze your response timing — if teams are overwhelmed with alerts, you might need to adjust thresholds or combine related triggers.
- Evaluate your intervention success rates — which actions actually help customers recover and which don't show clear impact.
Use real results to guide changes. If certain customers consistently slip through despite monitoring, examine what signals you missed. When interventions work well, document the specific actions that helped. When new patterns emerge, like changes in how customers use features, update your tracking accordingly. Each iteration should make your system more precise and effective.
Pro Tip: Create a monthly optimization routine — review key metrics, gather team feedback, and make focused improvements one area at a time.
References
- How to Create Customer Health Scores | Gainsight | Gainsight Software
Topics
From Course

Images provided by

Share


Similar lessons

Analytics Strategy & Planning
Data Collection & Tracking
