Customer Journey Mapping for Churn Prevention
Explore how to map user touchpoints within customer journey maps (CJM) to identify and prevent churn risks.
Customer journey mapping is a powerful tool in the fight against churn, offering a visual representation of every interaction users have with your product or service. By mapping out these touchpoints, businesses gain invaluable insights into the user experience, identifying pain points and opportunities to enhance satisfaction and loyalty.
This process illuminates the critical moments where users are most likely to disengage, allowing for targeted interventions and improvements. Journey maps reveal not just the what and when of user interactions, but also the how and why, providing context for user decisions and emotions throughout their experience.
Armed with this knowledge, companies can proactively address issues before they lead to churn, streamline processes to reduce friction, and create more personalized, engaging experiences that keep users coming back. From onboarding to long-term engagement, customer journey mapping offers a holistic view of the user experience, empowering businesses to craft strategies that not only prevent churn but also foster lasting relationships with their customers.
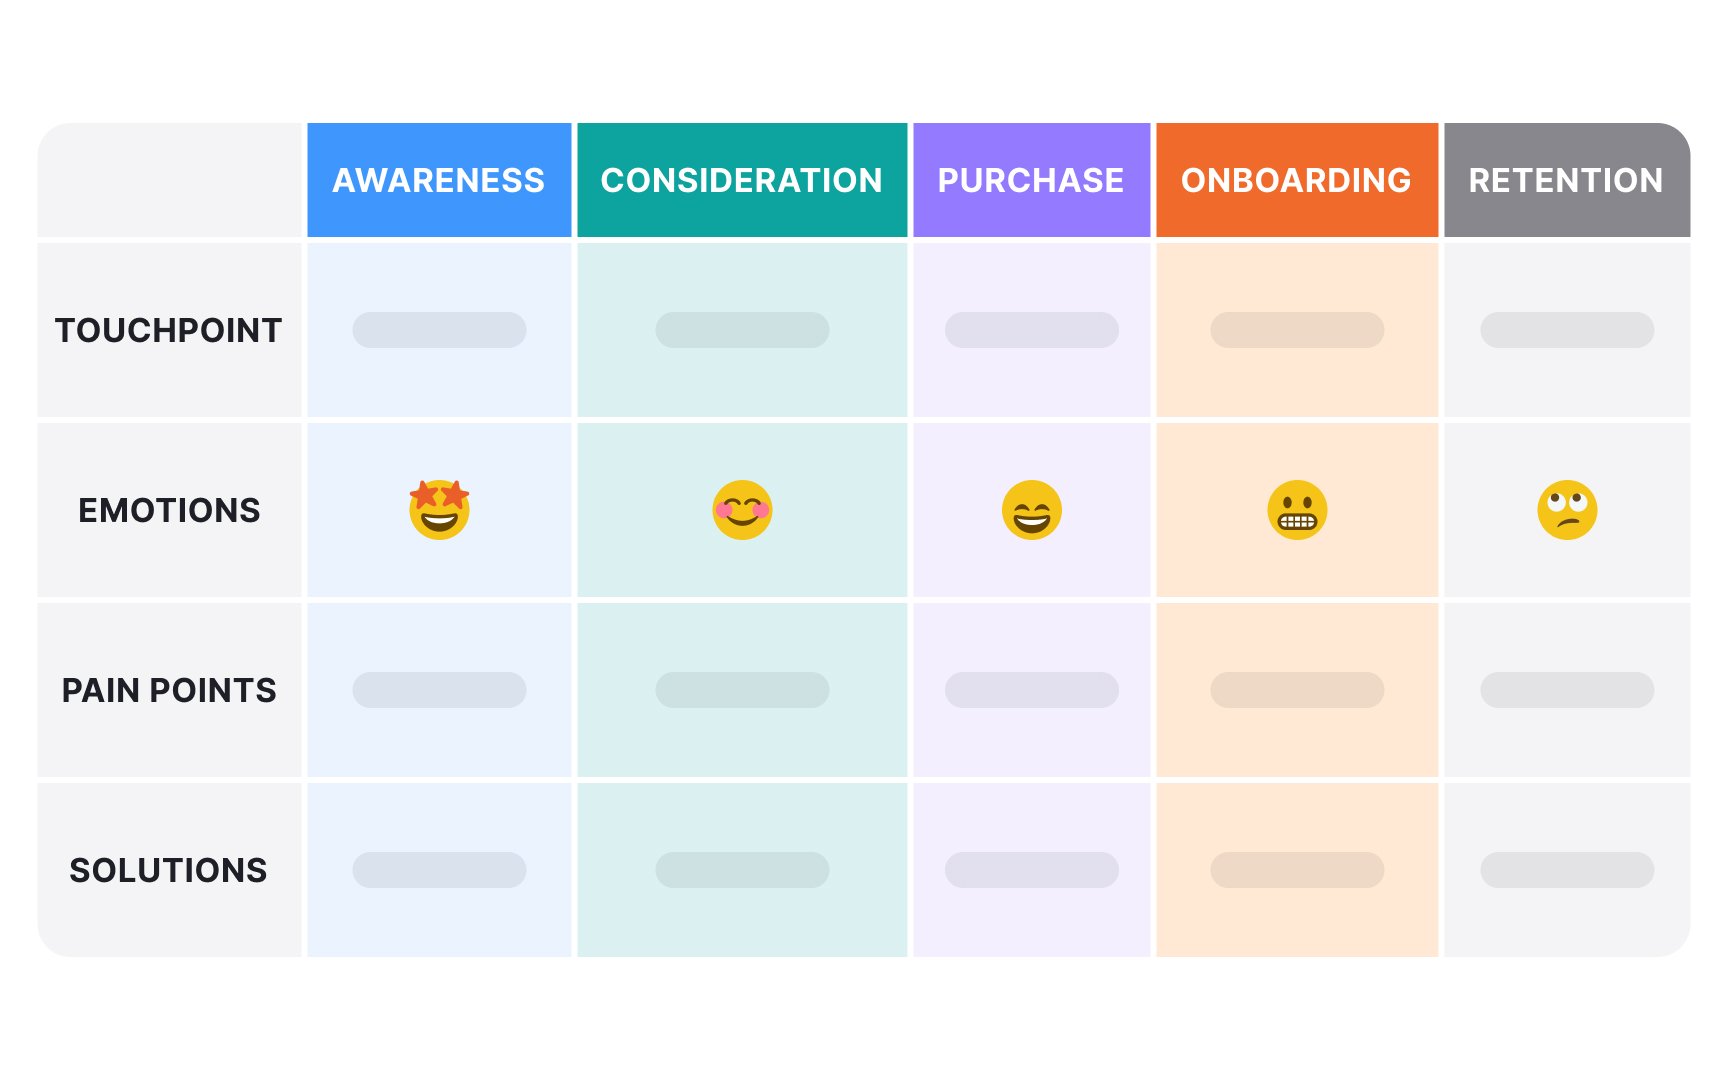
Key components of a
- Touchpoints: All instances where users interact with your product or brand.
- User actions: What customers do at each stage of their journey.
- Emotions: How users feel during different parts of their experience.
- Pain points: Areas of friction or dissatisfaction that could lead to churn.[1]
Touchpoints are critical moments of
Consider these important touchpoints in the user lifecycle:
- Initial discovery: How users first learn about your product.
- Sign-up process: The steps involved in creating an account.
- First-time use: The initial experience with your product's core features.
- Engagement milestones: Key achievements or usage thresholds.
- Customer support interactions: Any time users seek help or information.
- Renewal or upgrade decisions: Moments when users choose to continue or expand their relationship with your product. [2]
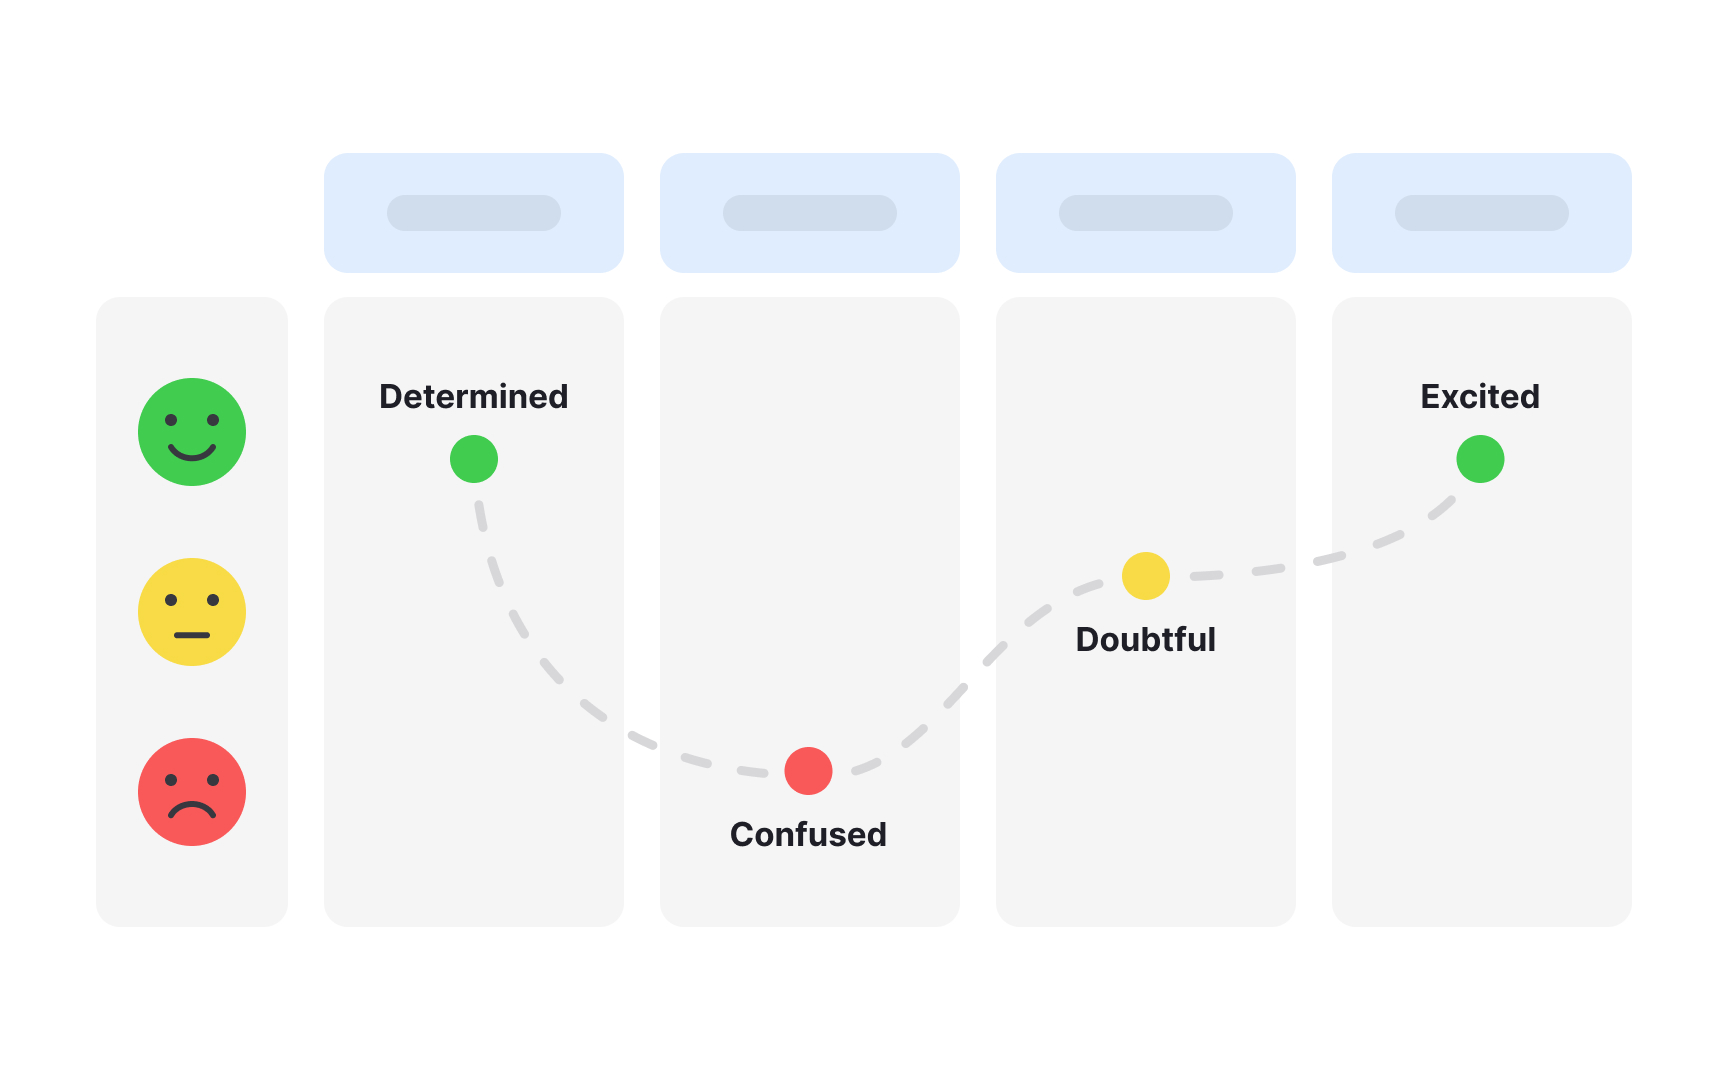
Understanding the emotional journey of users is crucial for preventing
Consider these aspects when analyzing emotional highs and lows:
- Positive emotions: Moments of delight, satisfaction, or accomplishment.
- Negative emotions: Instances of frustration, confusion, or disappointment.
- Neutral periods: Times when users feel indifferent or disengaged.
Identifying these emotional patterns helps in:
Pro Tip: Use surveys, user interviews, and sentiment analysis of customer feedback to gauge emotional responses at different journey stages.
Key churn risk indicators to look for in journey maps include:
- Declining engagement: Reduced frequency or duration of product use
- Negative emotional spikes: Sharp drops in satisfaction or frustration points
- Feature abandonment: Users stop utilizing key product features
- Increased support tickets: A surge in help requests may signal usability issues
- Delayed or missed payments: Financial friction can lead to churn
- Low feature adoption: Failure to use new or core features may indicate lack of perceived value
Recognizing these indicators allows teams to prioritize interventions and design targeted retention strategies.
Pro Tip: Focus on patterns of multiple risk indicators rather than isolated events to identify high-risk users.
The
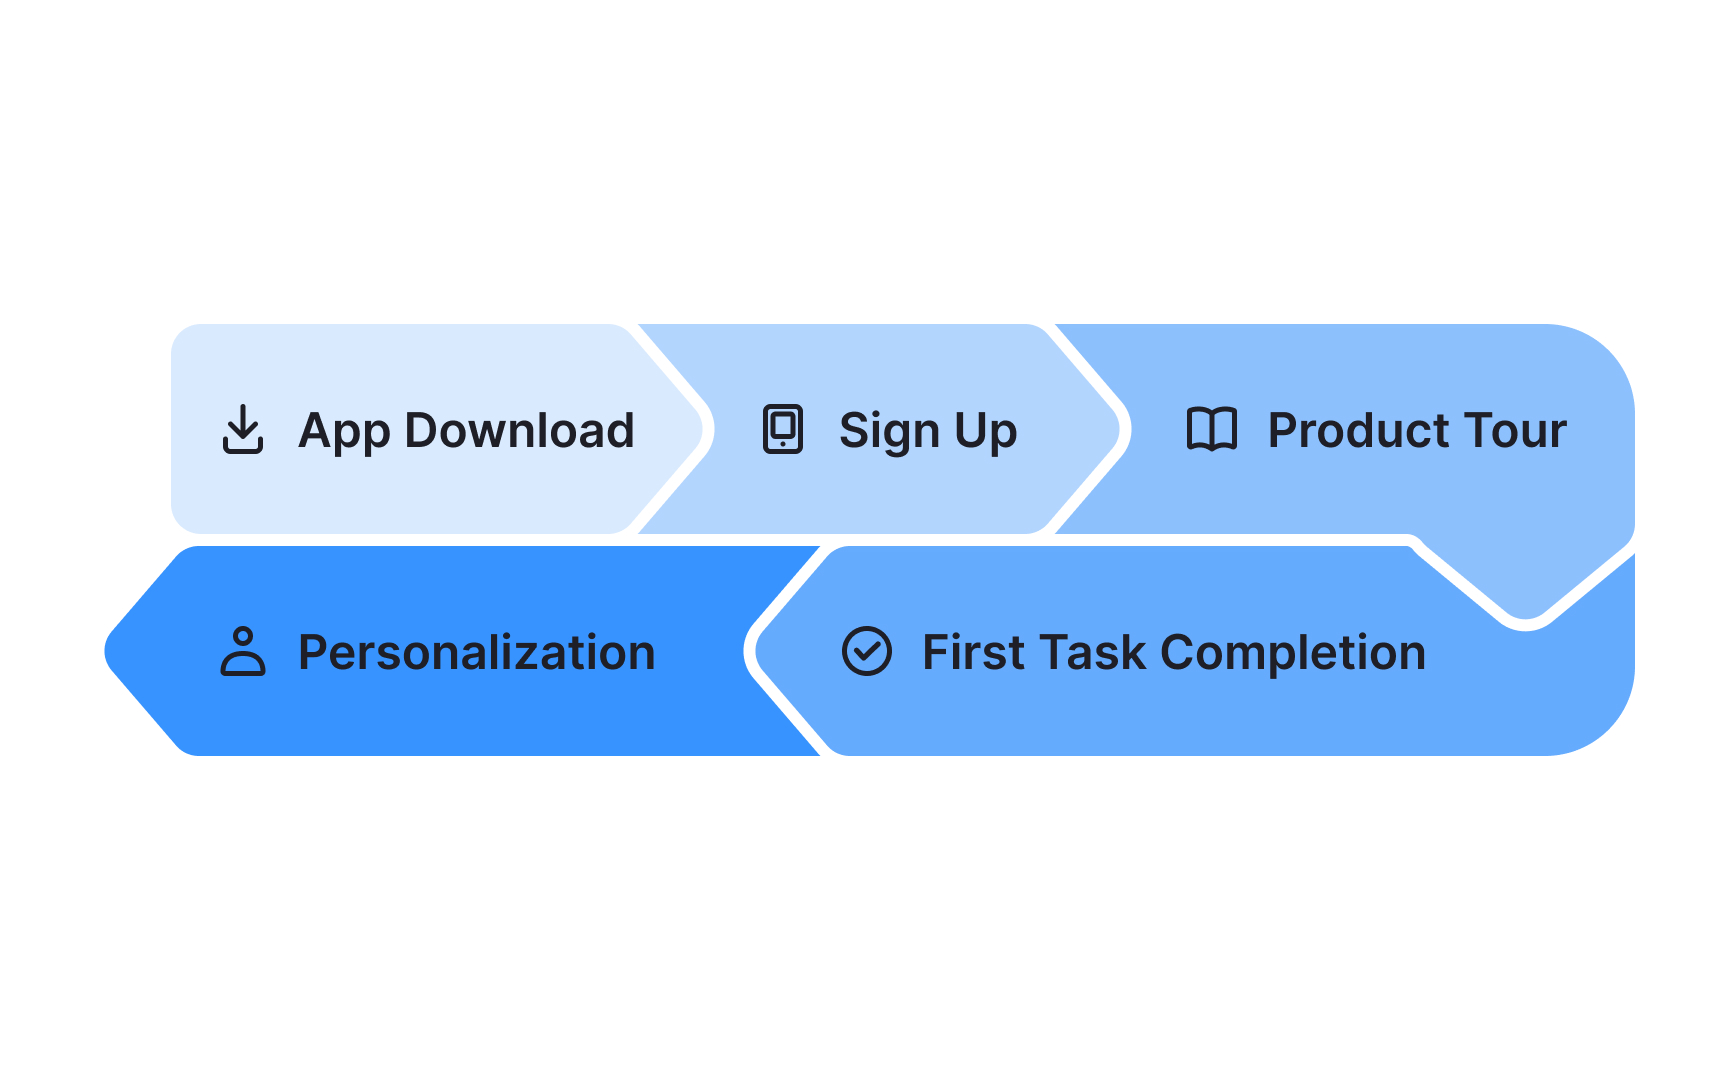
Key elements to consider when mapping the onboarding experience include:
- First-time app open or website visit
- Account creation process
- Product tour or feature introduction
- First meaningful action within the product
- Early wins or value realization moments
Understanding these touchpoints allows you to streamline the onboarding process, reduce friction, and increase the likelihood of user activation and retention.[4]
Pro Tip: Use progressive onboarding to introduce features gradually, avoiding overwhelming new users.
User activation and engagement are critical milestones in preventing
For example, consider a task management app:
- Activation trigger: Creating the first task
- Engagement metric: Logging in at least 3 times a week
- Time to value: Duration between sign-up and completing a task
- Friction point: Complexity in setting up task categories
By focusing on these critical stages, you can significantly reduce early-stage churn and set the foundation for long-term user retention.
Pro Tip: Identify your product's "aha moment" and design your onboarding to lead users there quickly.
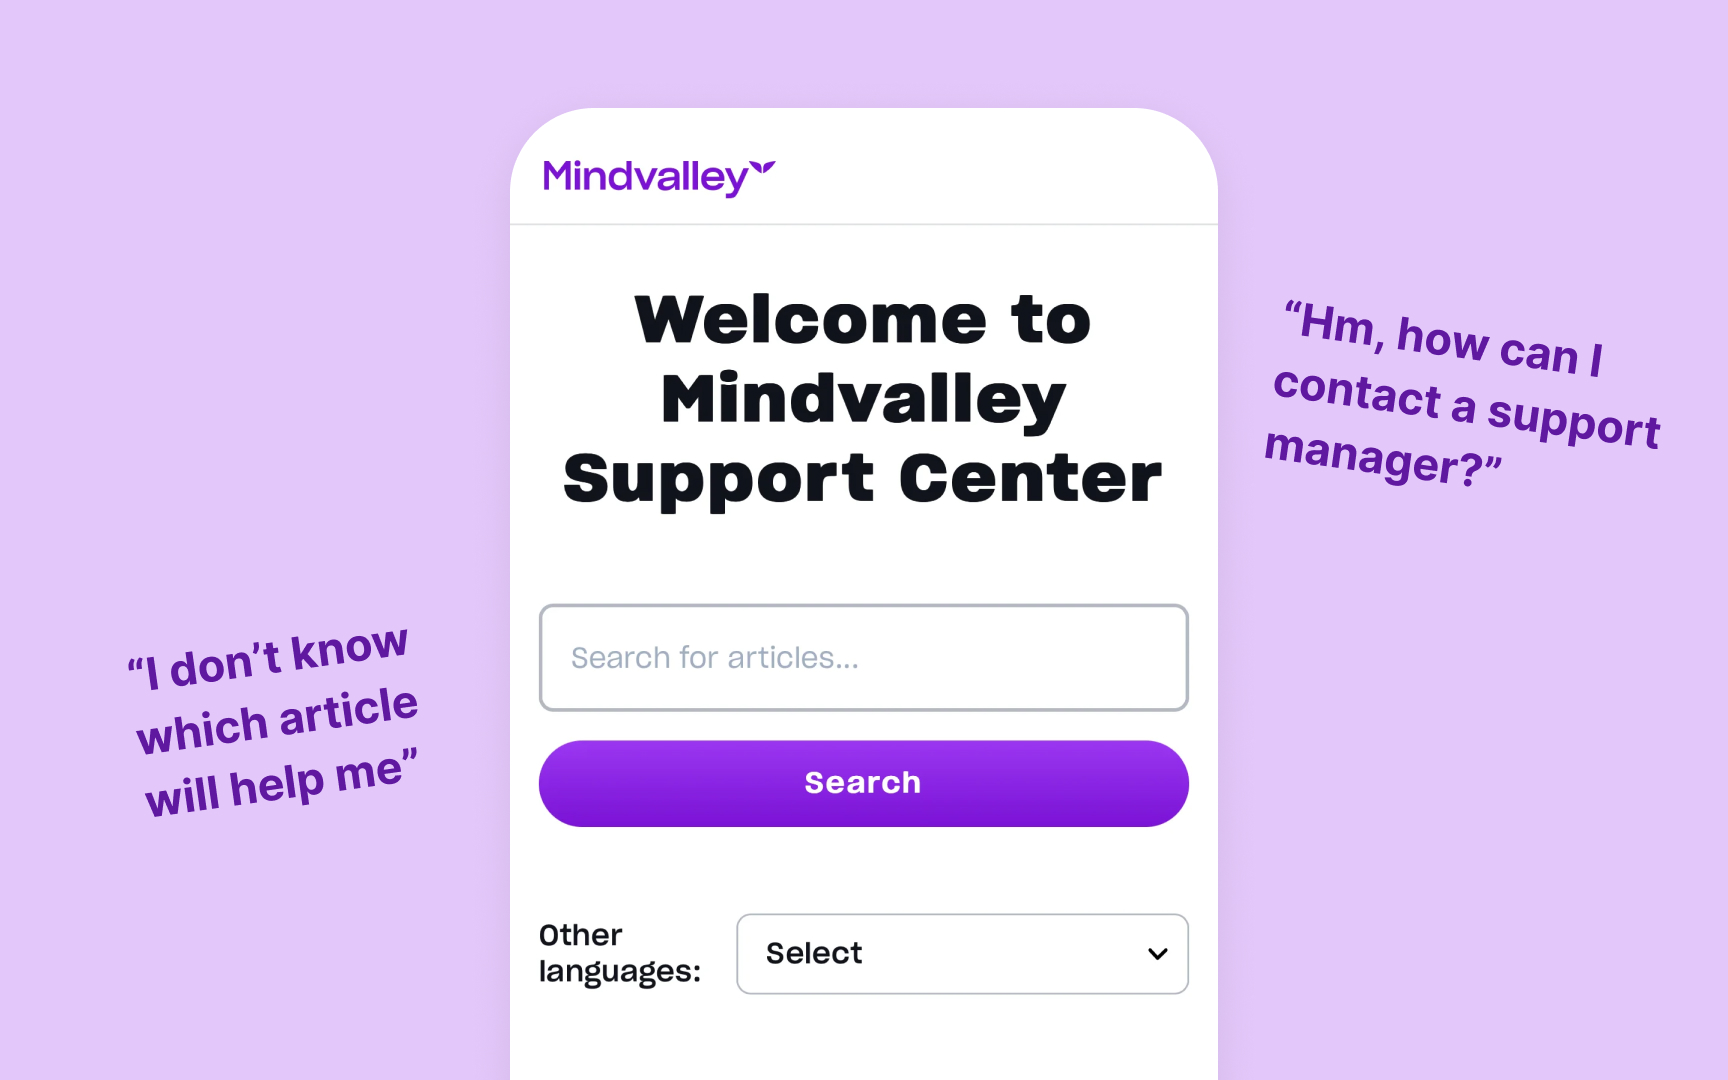
Friction points are obstacles or challenges that users encounter during their
Mindvalley's Support Center could be more helpful by adding quick links to human contact support and common issues, rather than relying only on search. Users who need help shouldn't have to guess the right search terms or dig through articles to find basic support options.
Common friction points in customer journeys include:
- Complicated sign-up processes
- Unintuitive navigation or user interface
- Slow loading times or performance issues
- Unclear pricing or subscription terms
- Difficulty in finding help or support
For instance, in an e-commerce app, a friction point might be a complex checkout process that requires too many steps or input fields, potentially causing cart abandonment.[5]
Pro Tip: Use heatmaps and session recordings to visualize where users struggle or abandon your product.
By analyzing the different paths users take and their
Key aspects of leveraging journey maps for personalization include:
- Identifying decision points: Moments where users choose between different paths or actions
- Recognizing user segments: Groups of users with similar behaviors or needs
- Mapping content to journey stages: Aligning information and features with user progress
- Timing interventions: Determining the optimal moments for personalized outreach
For example, an e-learning platform might use journey map insights to offer personalized course recommendations based on users’ progress and interests, or to provide timely encouragement messages when engagement begins to drop.[6]
Feedback loops are crucial mechanisms for continuous improvement and
Key considerations for integrating feedback loops include:
- Timing: Identify optimal moments to request feedback without disrupting the
user experience - Methods: Utilize various feedback collection methods such as in-app surveys,
email questionnaires, or user interviews - Actionability: Ensure feedback collected is specific and actionable for improvements
- Closing the loop: Communicate to users how their feedback has been addressed
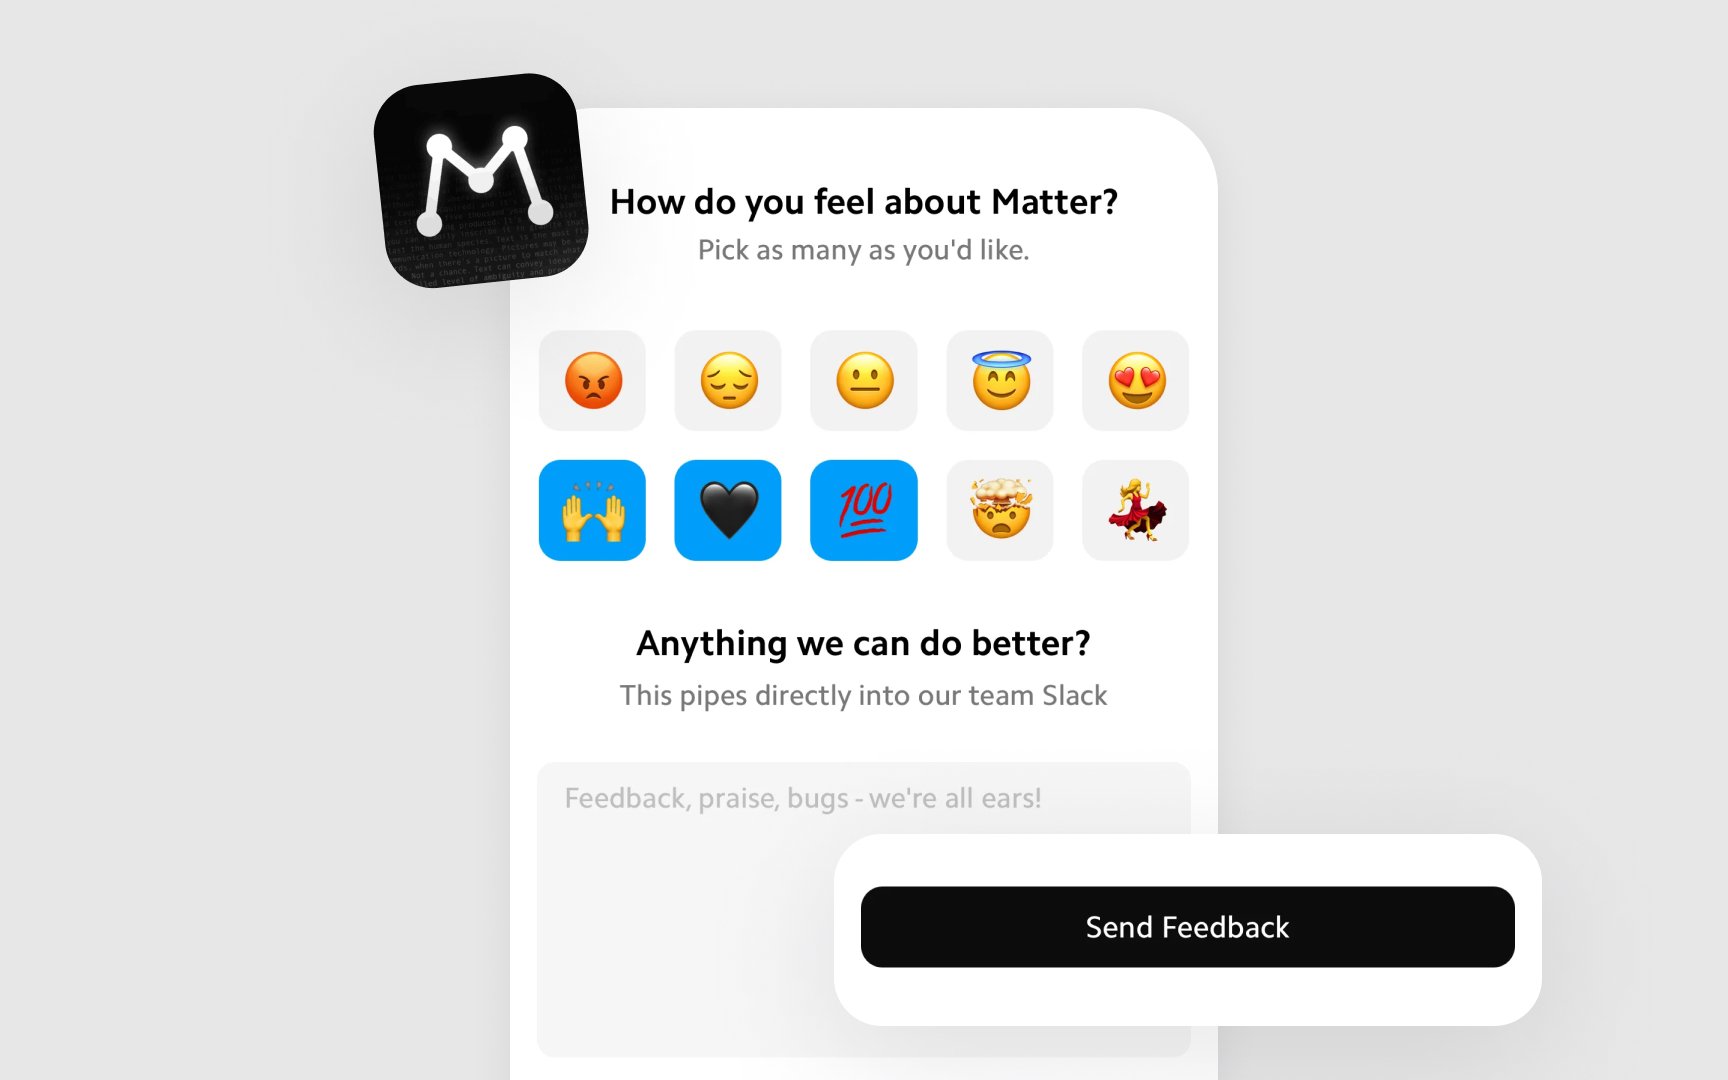
For instance, Matter demonstrates transparency in feedback collection by clearly stating where exactly users’
Pro Tip: Combine quantitative ratings with qualitative comments to gain a more comprehensive understanding of user sentiment and needs.
User segmentation is crucial for understanding the diverse needs and behaviors within your customer base. By creating distinct
Key aspects to consider when creating segmented journey maps include:
- Identifying segments: Use data to group users based on common characteristics, behaviors, or needs
- Customizing touchpoints: Recognize how different segments interact with your product at various stages
- Emotional mapping: Track sentiment and satisfaction levels unique to each segment
- Goal alignment: Understand how your product helps each segment achieve their specific objectives
For example, a fitness app might create separate journey maps for casual users, fitness enthusiasts, and professional athletes, each with distinct goals, usage patterns, and retention triggers.
By tailoring your approach to each segment, you can create more personalized experiences, address segment-specific
Pro Tip: Regularly update your segment definitions and journey maps as user behaviors and market conditions evolve.
Implementing changes based on
Key aspects to consider when measuring journey map improvements:
- Defining KPIs: Establish clear metrics tied to specific journey stages or touchpoints
- Before-and-after analysis: Compare key metrics before and after implementing changes
- Cohort analysis: Track how different user groups respond to journey improvements
- Customer feedback: Collect qualitative data to supplement quantitative metrics
For example, after optimizing the
Pro Tip: Use a combination of leading indicators (e.g., engagement metrics) and lagging indicators (e.g., retention rates) to get a comprehensive view of improvement impacts.
References
Top contributors


Topics
From Course

Images provided by

Share


Similar lessons

UX Design Processes & Research Methods

Qualitative UX Research Methods
