A/B Testing Churn Reduction Strategies
Master A/B testing to find proven retention solutions.
A/B testing transforms churn reduction from guesswork into a scientific process. This systematic approach to testing different strategies helps teams identify which actions truly prevent customer churn and which ones simply waste resources. By comparing two variations of a strategy — whether it's a new onboarding flow, a different customer communication approach, or an alternative feature introduction method — teams gather concrete data about what works best for their specific customers.
The process requires careful planning, clear success metrics, and statistical rigor to ensure results are meaningful and actionable. Control groups and test groups must be properly sized and matched for valid comparisons. Time periods need to be long enough to show real impact yet short enough to gather insights quickly. Each test builds upon previous learnings, creating a continuous cycle of improvement in churn prevention strategies. Proper A/B testing helps teams move beyond gut feelings and personal opinions, replacing them with data-driven decisions that demonstrably improve customer retention.
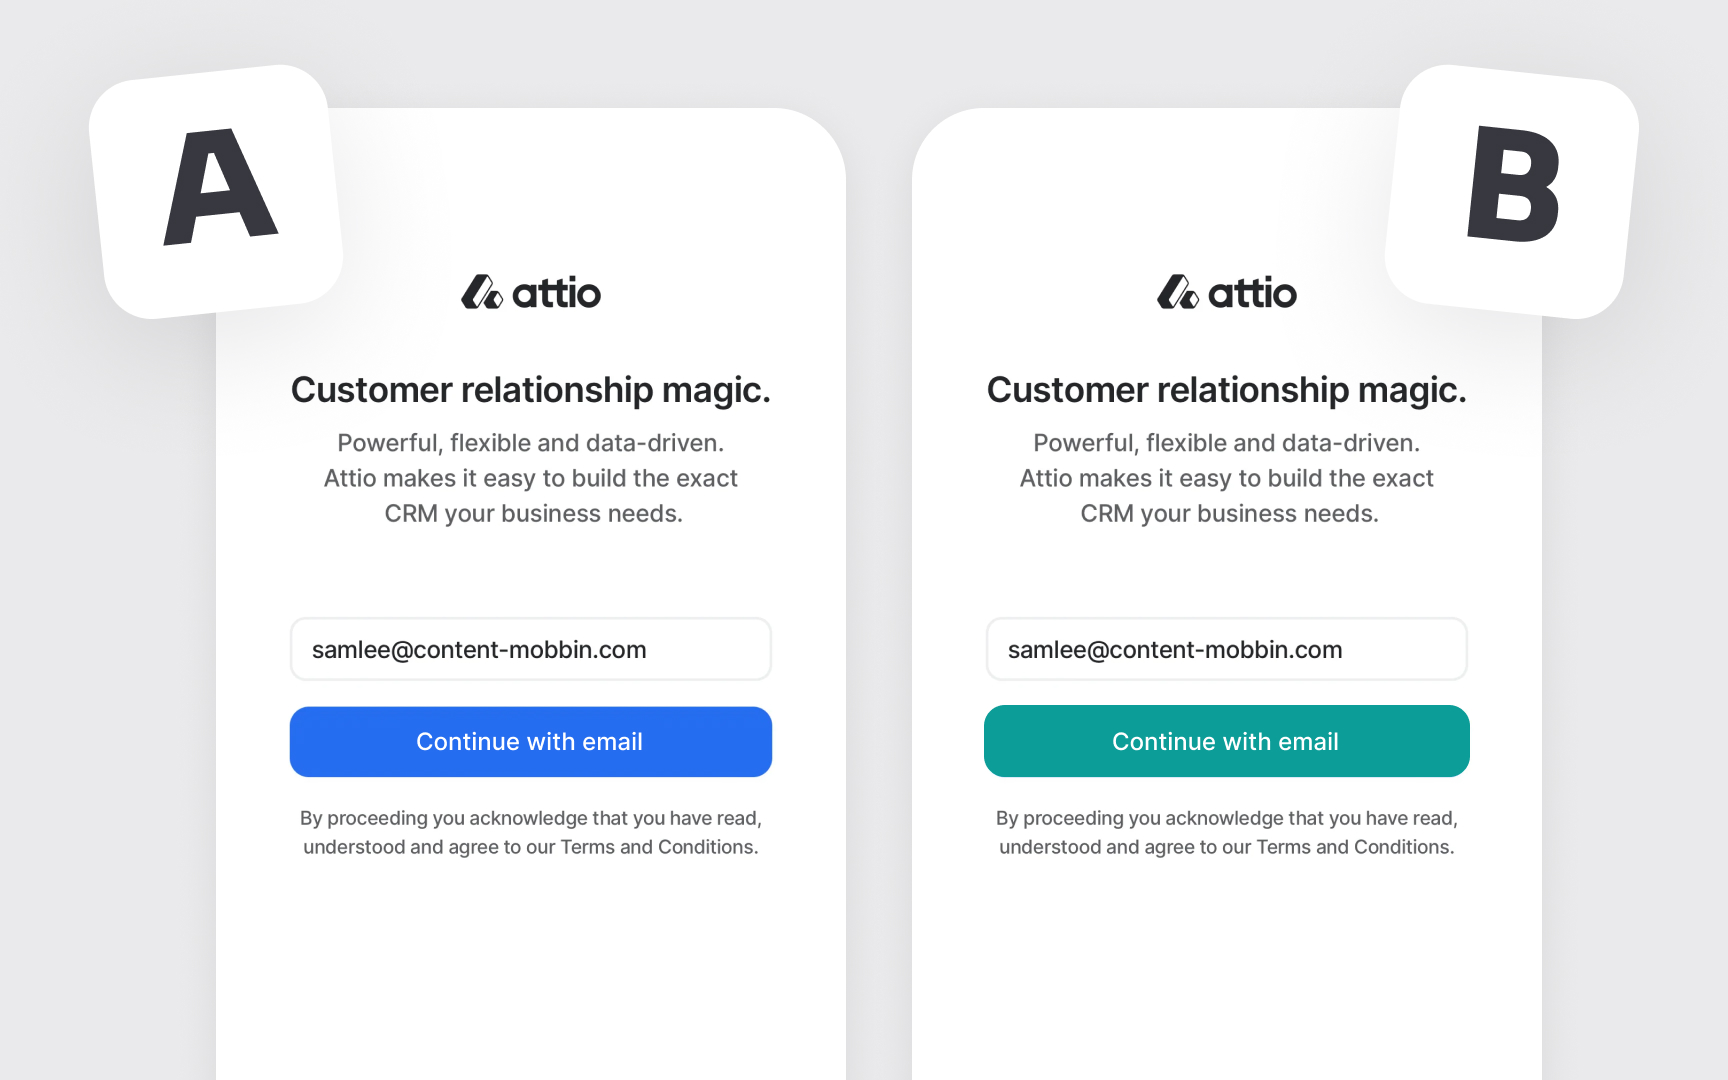
Every A/B test needs key elements to be valid. One group of customers gets the original strategy (A), while another similar group gets the modified version (B). The only difference between groups should be the change being tested. For example, when testing a new
The golden rule of A/B testing is to change just one thing at a time. Multiple changes make it impossible to know which change actually made a difference. Think of it like adjusting ingredients in a recipe — if you change three ingredients at once, you won't know which change improved the taste. This focused approach ensures clear, actionable results.[1]
Pro Tip: Start with testing big, obvious differences before testing subtle changes - dramatic differences are easier to measure and provide clearer learning opportunities.


Not every
The best test candidates have clear start and end points with measurable outcomes. Testing email subject lines, trial duration visibility, or pricing presentation makes sense because you can track exactly how many users respond to each variant.
However, testing broad improvements like file sharing experience doesn't work because it involves multiple complex variables and interactions that are difficult to isolate and measure. Consider the scope of the change when selecting strategies to test. Focus on testing one element at a time, like the placement of a trial end date or the display of storage options. These focused tests give you clearer insights about what actually impacts user behavior and conversion rates.[2]
Pro Tip: List all the variables in your proposed test — if you can't control each one, break your test into smaller pieces.
Control groups are sets of customers who keep using your current solution while others test the new version. For example, when testing a new
Creating balanced control groups means choosing customers with similar characteristics for both groups. If your test group includes both enterprise and small business customers, your control group needs the same mix. The only difference between the groups should be the change you're testing. While random assignment often creates this balance naturally, always check if your groups truly match in size, type, and behavior patterns.
External factors can affect how your customer groups behave during the test. Seasonal changes, marketing campaigns, or product updates might influence one group differently than another. Also ensure each group has enough customers — small groups might show random variations that look like real differences. Both control and test groups should be large enough to represent your typical customer base.[3]
Test parameters define the rules and boundaries of your
- Specify the exact change you're testing — for instance, the precise wording of a new upgrade reminder
email . - Set the test duration — long enough to gather meaningful data but short enough to act on results quickly.
- Determine test conditions like which customers to include and what might force an early test end.
Sample size is a crucial parameter that affects test reliability. Too few customers in each group makes it hard to tell if differences are real or random chance. Calculate your needed sample size based on how big a difference you need to detect. For example, if you need to spot a 20% improvement in upgrade rates, you'll need enough customers to make that difference clear.

Success metrics are specific numbers that tell you if your test worked. Choosing the right metrics means focusing on customer actions that directly connect to reducing
Good metrics should be both relevant and reliable. Relevant metrics directly relate to customer success — like measuring how often customers use core features rather than just how often they log in. Reliable metrics show consistent patterns that you can trust. Keep your metric list focused and prioritized. Primary metrics directly measure the change you're testing, while secondary metrics help spot unexpected effects. If you're testing a new upgrade notification, your primary metric might be upgrade
Pro Tip: Choose metrics you can measure the same way for both test groups — if you can't track it consistently, it's not a good test metric.
Parallel testing means running multiple A/B tests simultaneously on your website or product. This practice can speed up learning, but it comes with specific requirements to ensure valid results. The key is understanding how multiple tests might interact with each other and what precautions to take. There are 2 main approaches to running parallel tests:
- Section-based testing keeps different tests confined to separate areas of your product — like testing a new
onboarding flow while separately testing account settings. - User-based testing assigns users to specific test groups and ensures they stay in those groups across all tests. Both approaches help prevent test contamination and maintain clear results.
Test
Pro Tip: Start with two parallel tests maximum until you understand how they affect your sample size and significance calculations.
Test analysis turns raw data into clear conclusions about what worked. Like interpreting medical test results, it requires both careful data examination and practical understanding of what the numbers mean for your customers. Good analysis tells you not just whether there was a difference between groups, but whether that difference matters.
Focus first on your primary success metrics. Compare the test group's performance directly against the control group's baseline. Look for clear patterns — if your new
Consider the full context of your results. Check if external factors might have influenced the outcome. For example, if you tested during a holiday period or major product update, these events could affect your results. Also examine secondary metrics to spot any unexpected effects. A positive change in one area might have hidden costs in another, like higher engagement but also increased support requests.
Statistical significance combines statistical evidence with practical business impact to validate test results. Like scientific research, solid validation looks at both mathematical proof through p-value (a number between 0 and 1) and real-world effects that matter for your business goals. A strong test shows both types of significance.[5]
Measuring statistical significance starts with p-value calculations. A p-value below 0.05 indicates a 95% confidence level that your results reflect real differences. Practical significance focuses on effect size — the magnitude of change your test created. For example, a 20% increase in
Sample size and test duration form crucial parts of validation. Your test needs enough users and time to produce reliable data, but not so much that tiny differences appear meaningful. Calculate required sample size before starting, and plan your test duration to capture true behavior patterns. Remember that larger changes need fewer samples to validate, while subtle differences require more data to confirm.[6]
Pro Tip: Focus on changes that show both clear statistical proof (p < 0.05) and meaningful effect size for your business.
Implementing test winners means moving successful changes into your regular product experience. Like rolling out a successful pilot program, this process requires careful planning to maintain the benefits you saw in testing. Good implementation preserves the exact conditions that made your test successful. Create a detailed implementation checklist before rolling out changes. Document the specific elements that worked, including exact wording, timing, or design details that contributed to success. For example, if a new
Pro Tip: Create a "test conditions" document that captures every detail of your winning variation — it helps ensure nothing gets lost in implementation.
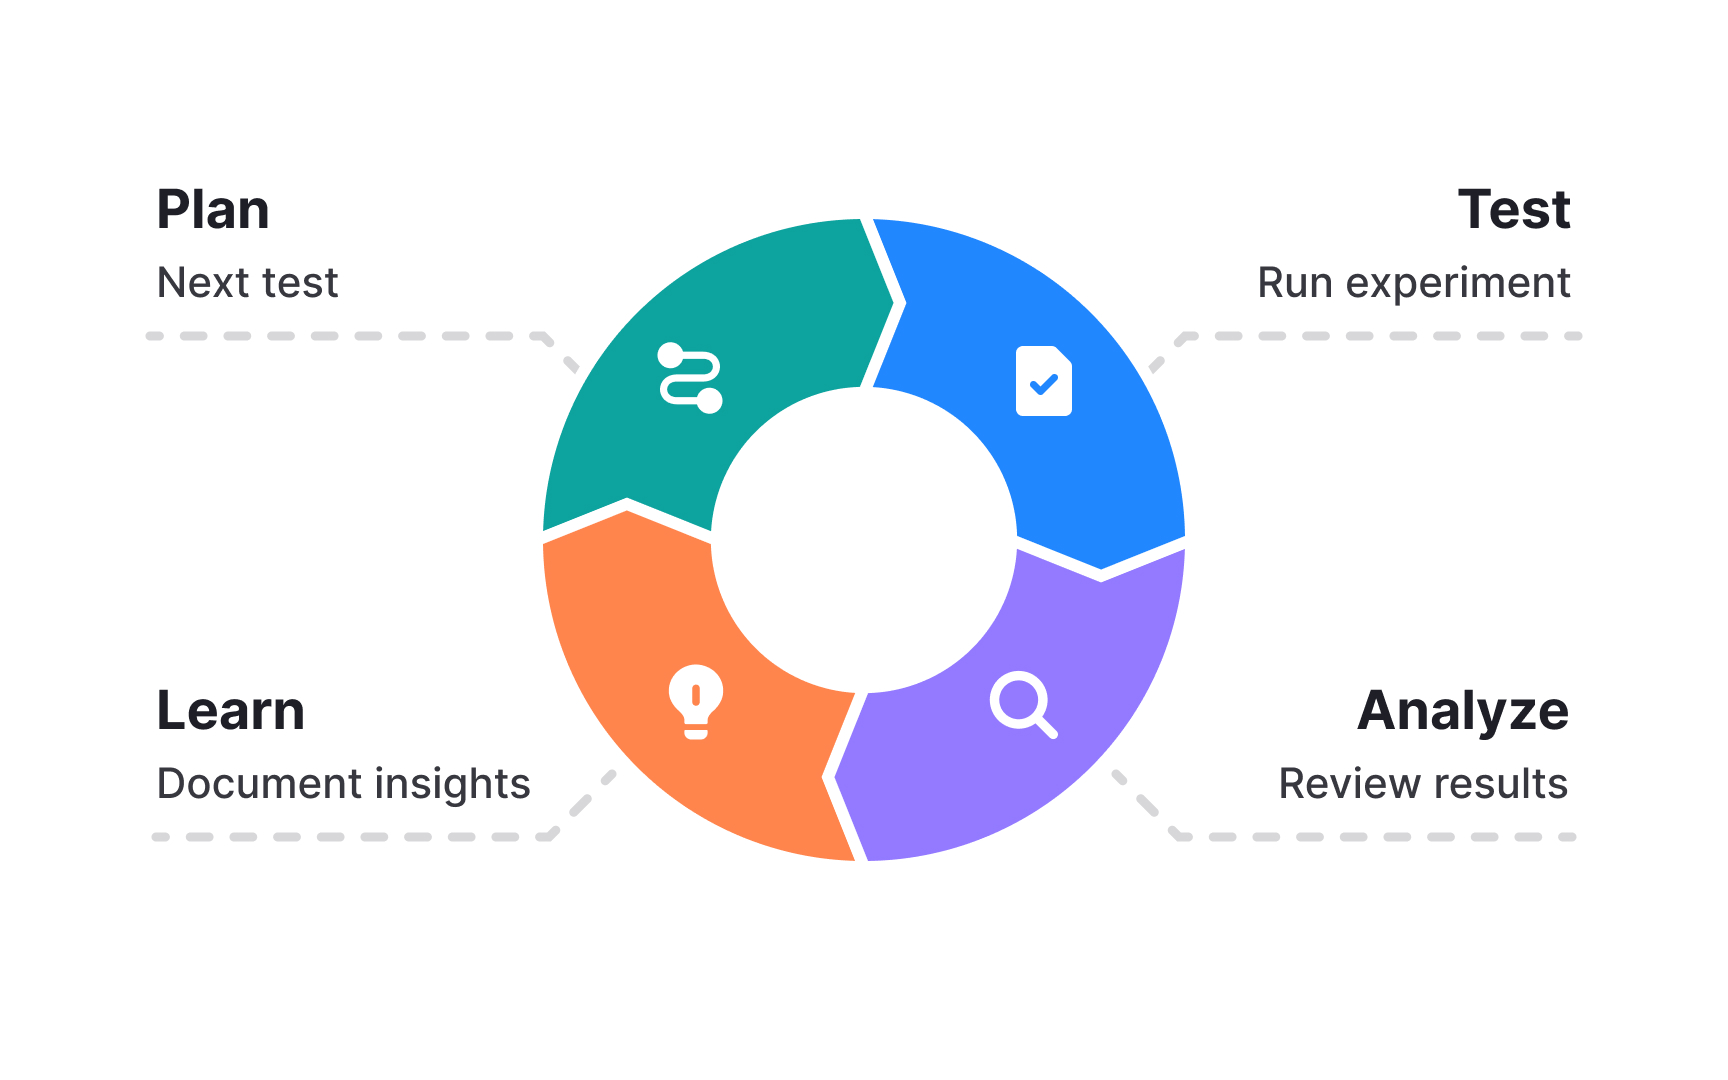
Iteration cycles turn single test results into continuous improvement. Each test should lead naturally to the next one, building on what you learned. Think of it like solving a puzzle — each piece you place helps you see where to look for the next one. Good iteration starts with organizing your learnings. Create clear records of what worked, what didn't, and what surprised you in each test. For example, if a new feature tutorial showed better results with video format, you might test video tutorials in other areas. If shorter messages worked better in
Use both successful and failed tests to guide your next steps. Success points toward similar opportunities — like expanding winning changes to related features. Failures often reveal new questions to test. For instance, if customers didn't engage with a new dashboard layout, test whether the problem was the design, the timing, or the feature placement.
References
- A Refresher on A/B Testing | Harvard Business Review
- A/B Testing: How to Get It Right | Harvard Business Review
- A/B Testing, Usability Engineering, Radical Innovation:What Pays Best? | Nielsen Norman Group
Topics
From Course

Images provided by

Share


Similar lessons

10 Usability Heuristics by Jakob Nielsen

Usability Heuristics
